Keywords
cascades, optimization, modeling, service delivery
cascades, optimization, modeling, service delivery
The pursuit of effective program delivery has become a dominant theme in the discussions and strategic thinking of both national and international health and development agencies. Both the Paris Declaration on Aid Effectiveness1 and the Accra Agenda for Action2 emphasized the need for results-based evaluation to assess whether funds are being used efficiently towards achieving desired outcomes, and this has played an important role in shaping the thinking around results measurement more broadly. To support the emphasis on results-based evaluation, a multitude of systems are in operation for collecting and aggregating program result data3. In theory, these data are intended to enable organizations to assess which strategies and programs are effective, identify elements of programs associated with better results, demonstrate accountability to external stakeholders, and make decisions about allocating further funding3. In practice, however, there is a disconnect between the data being collected and the methods available for analyzing them.
One method for quantifying how health and development programs are servicing the needs of communities is to define progressive stages of engagement on the path towards a successful outcome, and to measure what proportion of the overall target population has attained each stage. Often, these proportions are plotted as successive bars, in a representation known as a cascade, a care cascade or a service cascade (Figure 1). Cascades can be studied at a population level (left panel of Figure 1), or at a disaggregated sub-population level (right panel of Figure 1).
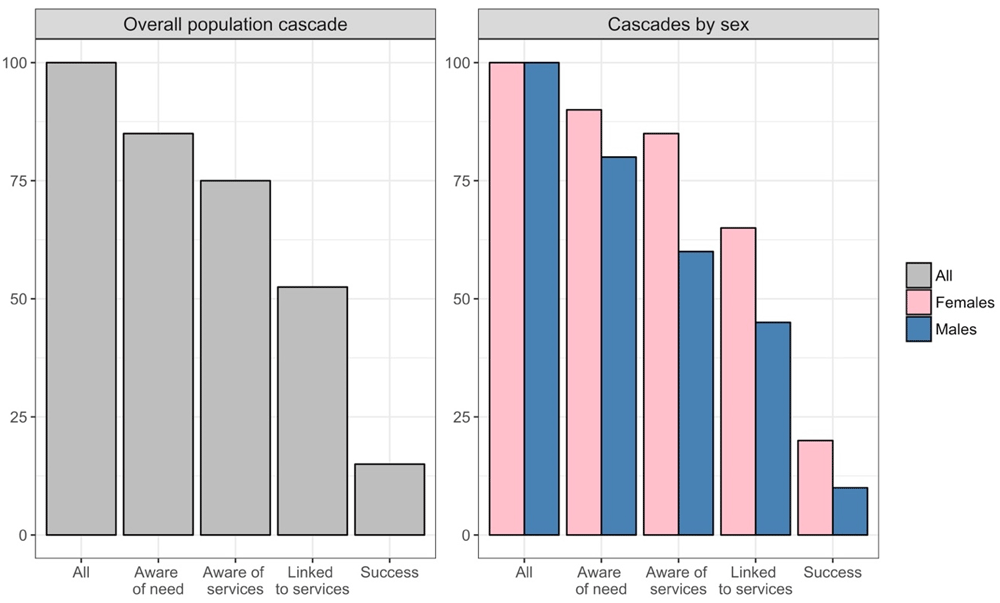
The left panel is aggregated across the total population, and the right panel shows the same information but disaggregated by sex.
Within public health, cascade-type models were explored as early as the 1960s for analyzing the success of tuberculosis programs4, but the concept of a cascade really gained traction within HIV5, where it is used to characterize the steps of care that people living with HIV go through. The HIV care cascade has been adopted in many countries as a population-level tool to evaluate the progress of individuals through the HIV care continuum5–8. Following their success in HIV, cascades began to be applied to other areas of health. Tuberculosis followed soon after HIV, with the 2014 End TB Strategy including targets related to the latent tuberculosis cascade of care, and the following year’s Global Plan To End TB 2016–20209 including a commitment to measure progress towards these targets. Subsequently, an explicit framework of analysis to account for the losses during each individual step in this cascade was developed10 and applied in South Africa11, India12 and many other countries. The cascade approach has also been applied to the analysis of diabetes, most notably in a 2014 study that provided a comprehensive overview of the continuum of U.S. diabetes care (including a visualization of gaps in awareness of diagnosis, engagement, and treatment) by analyzing nationally representative data benchmarked against care recommendations for cardiovascular risk management13. Building on this, a recent study in South Africa used data from the first comprehensive national survey on non-communicable diseases to construct a diabetes care cascade by categorizing the population with diabetes into those who were unscreened, screened but undiagnosed, diagnosed but untreated, treated but uncontrolled, and treated and controlled14. The cascade framework has also been proposed as an analytic tool in hepatitis C15, other sexually transmitted infections16,17, addiction care18,19, and mental health20. Outside of public health, a related concept – funnel analyses – have proven useful in analyzing consumer behavior within ecommerce, retail, and online gaming/applications.
Across all of these different applications, cascades have proven to be an effective visual tool for identifying weaknesses at different stages of service engagement, as well as unacceptable variations between different groups or countries. In addition, a handful of studies have pushed the analytic capacity of cascades one step further, employing them as a tool for identifying what mix of technologies and services should be provided, and to which populations, in order to best ensure that outcomes are met. A study of the HIV cascade in Kenya looked at how varying the coverage levels of five different interventions could improve the care cascade21. An unpublished study conducted in South Africa further extended this idea, introducing the concept of ‘optimizing the cascade’, which meant calculating the coverage levels across 30+ HIV interventions that would maximize the number of people virally suppressed by 2030.
Although there are many prior examples of cascade analyses, and even a few specifically on cascade optimization, these have all been disease-specific use cases. The lack of a readily-available modelling tool has substantially limited the potential for widespread uptake of cascade analyses and cascade optimizations. The purpose of this work is to begin with the concept of a cascade and implement it as a general software tool – called the Cascade Analysis Tool – that allows the same quantitative methods to be applied across application areas in health and development. The Cascade Analysis Tool is intended to address a set of key policy questions, as outlined in Figure 2. Methodologically, it is based on a compartmental mathematical model structure equipped with methods for parameterizing transition probabilities, and with a suite of inbuilt optimization methods for ‘optimizing the cascade’; that is, finding the annual investment or coverage levels for each intervention that would result in the cascade being as close as possible to some target distribution, subject to constraints on the overall budget and the pace of scale-up over time.
The Cascade Analysis Tool is available as open access software package, developed in Python and available via GitHub. We also developed a graphical user interface to enable interested users to access the software via a web-based application. Throughout this paper, we refer to an illustrative example of a hypertension cascade; this example, along with several other pre-made models, are available to all users as part of the library of ‘demo’ projects included with the software.
The Cascade Analysis Tool is intended to provide a practical way for stakeholders to utilize the increasing quantities of data on the costs, coverage, and impact of health and development interventions, and modalities through which these interventions are delivered to individuals, thus addressing some of the disconnect between the kinds of data being collected and the methods available for analyzing them.
The Cascade Analysis Tool is a web application written using the Atomica and Sciris packages. The Cascade Analysis Tool comes with a library of pre-made cascades that can be immediately used for analyses. Alternatively, users can design their own cascade (see details in the next section).
The Cascade Analysis Tool can be run on any browser. The workflow creating and analyzing a cascade in the Cascade Analysis Tool consists of three key steps: designing the cascade, collating data, and analysis. If using one of the pre-made cascades in the Cascade Analysis Tool’s library, it is possible to skip the first step.
Designing the cascade. The Cascade Analysis Tool is intended to be as flexible as possible, meaning that nothing about the cascade design is pre-determined. Thus, designing the cascade is the starting point for any cascade analysis. We will first show how a cascade can be represented as a compartmental model, and then provide details on how to set up a compartmental model representing a cascade within the Cascade Analysis Tool.
Representing a cascade as a compartmental model
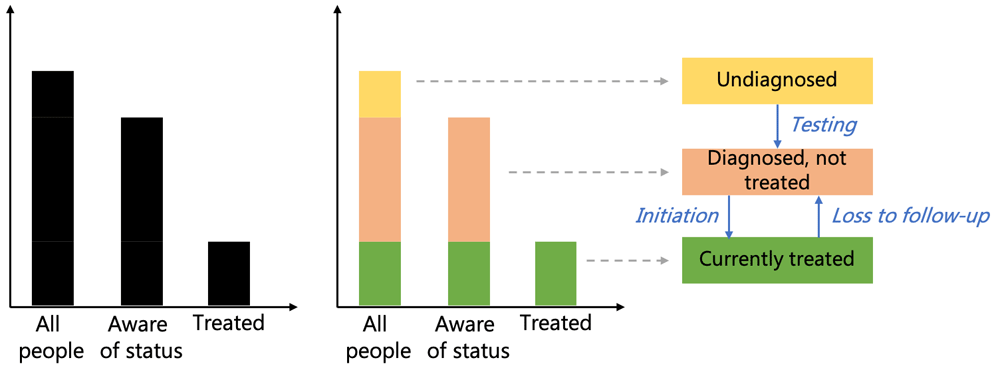
Conceptually, the process of designing a cascade is illustrated in Figure 3. Beginning with a simple cascade representation, in which the progressive stages along the path to a successful outcome are plotted (Figure 3a), the next step is to break down each cascade bar so that it consists of the sum of all the bars that came before it, plus the difference between the height of the previous bars and the height of the current bar (Figure 3b). These differences represent the mutually exclusive states that a person can be in. This representation in terms of mutually exclusive states allows us to model the cascade using a compartmental model, which is one of the main workhorses for disease modeling in general. A compartmental model consists of a set of mutually exclusive states that a person can be in, plus a set of transitions between them (Figure 3c).
Creating a compartmental model
Having completed the conceptual stage of designing the cascade, resulting in a representation of the cascade as a compartmental model, users can then proceed to create their model in the Cascade Analysis Tool. This is done by creating a framework file, which is a Microsoft Excel spreadsheet containing the specifications of the model. A model consists of three mandatory components – compartments, transitions, and parameters. The framework also contains two additional optional quantities, characteristics and cascades, which facilitate data entry and analysis. The design of the cascade and the initial consideration of available data should often be carried out in parallel because the selection of quantities included in the model directly affects which quantities are required for data entry.
Compartments
Figure 3 illustrates the process of transforming a typical cascade representation into a set of compartments, labelled as “Undiagnosed”, “Diagnosed, not treated”, and “Currently treated” in Figure 3c. To set up a model using the Cascade Analysis Tool, the first step is to define these compartments in the framework file.
The selection of compartments is often driven by desired outputs, which in turn reflect available data. For example, if one of the aims of the cascade analysis is to assess barriers to diagnosis following screening, then there should be compartments for both screened individuals and diagnosed individuals. In contrast, if there is no screening step, if there are no interventions targeted to reduce barriers to diagnosis, or if screening is not relevant to the analysis at hand, then it may be sufficient to only have a compartment for diagnosed individuals.
Transitions
In Figure 3c, there are arrows between the compartments that illustrate the paths that people can take between different states. For example, people can go from “Undiagnosed” to “Diagnosed, not treated” after receiving a test, or from “Currently treated” to “Diagnosed, not treated” if they are lost from care. A pathway leading from one state to another is called a transition. Within the Cascade Analysis Tool, each transition is given a name and is defined as a function of one or more parameters.
Parameters
Parameters are used to define the values associated with transitions in the model. In the example presented in Figure 3, the parameters are the testing rate, the treatment initiation rate, and the loss-to-follow-up rate. A parameter can be associated with more than one transition – for example, the background death rate applies to all individuals regardless of their disease status. When using the Cascade Analysis Tool, users have a choice of either directly entering data on these parameters, or allowing their values to be calculated as a function of other model quantities (such as other parameters) by entering formulas into the framework file. This means that complex computations and functional dependencies can be readily used. The parameterization of the transitions needs to be carefully thought out with relation to the available data.
Characteristics
Characteristics are defined as groupings of model compartments. The most common use case would be to define each of the cascade stages as a characteristic. For example, in the model introduced in Figure 3, we would consider “Aware of status” to be a characteristic of the model, since it is the sum of two compartments. Specifying characteristics is optional – it is possible to set up a framework file that only contains compartments, transitions, and parameters – but characteristics are a useful way of summarizing information about the distribution of people in multiple different compartments, which is an essential part of a cascade analysis.
Collating data. The next key step in a cascade analysis is to collate data. Data collation is specific to a particular context, and users create a project for encapsulating all of the data and analyses specific to that context. Creating a project requires selecting the framework that will be used as the basis for the cascade model structure, selecting the number of populations to include, and selecting the years for which data will be collected. Data entry itself is done in two Excel spreadsheets, referred to as the databook and the program book, both of which are automatically created by the Cascade Analysis Tool once a project has been created. Within the databook, users enter data on each parameter that influences the rates at which people move through the cascade, and within the program book, they enter data on the interventions that influence the parameters. The Cascade Analysis Tool comes with a library of pre-filled databooks and program books that can be immediately used for demonstration analyses. The next section on use cases illustrates the process of data entry with reference to an example.
Analysis of policy questions. Having completed the cascade design and gathered the data, it is possible to begin using the framework to analyze policy questions, such as those illustrated in Figure 2. In many real-world situations, the impact of changing intervention coverage and the way in which interventions should be prioritized is not clear from an analysis of the intervention properties alone. The Cascade Analysis Tool allows users to construct scenarios and optimizations in order to quantitatively answer questions about intervention effects and priorities. Scenarios can be used within the Cascade Analysis Tool in order to assess the impact on the cascade of varying the investment or coverage level of a given intervention or modality.
Cascade optimization
Although scenarios are useful for analyzing cascades and for gaining insight on the impact of scaling up or down particular interventions or modalities, in realistic settings there are a very large number of different possibilities, and it quickly becomes infeasible to rely on constructing scenarios in order to determine what investment priorities should be. This is especially difficult given that the optimal investment strategy may change from year to year. For example, it might be optimal to start by scaling up treatment initiation services until everyone in need of treatment can access it, and then to focus investments on adherence and retention strategies subsequently.
The Cascade Analysis Tool contains a set of inbuilt optimization functions that can calculate the distribution of funding across service delivery modalities that results in the best possible cascade. ‘Best’ can be defined by the user – often, the aim is for as many people as possible to attain a successful outcome; in this case, the optimization algorithm would calculate the mix of investments that maximizes the proportion of the population with successful outcomes. However, it is also possible to specify different strategic goals, such as maximizing the number of people diagnosed. This functionality within the tool is primarily intended for central decision makers who are choosing the allocation of a budget. Fundamentally, the optimization system in the Cascade Analysis Tool seeks to modify the timing and funding allocation of interventions to optimize an aspect of the model outputs, subject to constraints on the changes it is allowed to make.
The optimization problem is separated into three components
The objective (i.e. defining what we are trying to achieve)
The adjustment(s) (i.e., what can be adjusted, and when, in order to meet the objectives)
Constraints (i.e., what conditions must be satisfied)
Separating these components out means they can be mixed-and-matched to suit a specific optimization problem. Finally, the optimization is numerically performed using one of several algorithms selectable by the user.
Objectives (i.e., what are we trying to achieve)?
The Cascade Analysis Tool allows the user to flexibly define objectives when designing the cascade. It also supports default options, as listed here:
Minimize the summed loss rates over each stage of the cascade
Maximize the number of people at any given stage of the cascade
Minimize the amount of funding required to meet a certain cascade target
It is possible for users to construct their own objective using any of the model’s outputs, as well as to combine multiple objectives into a single target.
Adjustment type (i.e., what can be adjusted, and when, in order to meet the objectives)?
The adjustments for an optimization are a specification of what is allowed to be changed in the model in order to achieve the optimal result. The Cascade Analysis Tool has several default options for possible adjustments
Immediate one-off allocation change: we ask what share of the annual budget should be allocated to each intervention in order to meet the objectives, subject to any constraints (see section below). The share of the budget allocated to each intervention is assumed to be constant over time, and we assume that the allocation of the budget can change immediately.
Delayed one-off allocation change: we ask what share of the annual budget should be allocated to each intervention in order to meet the objectives, subject to any constraints (see section below). The share of the budget allocated to each intervention is assumed to be constant over time, and we assume that the allocation of the budget can only change after a given year (for example, perhaps change can only take effect in the next planning phase).
Ongoing (time-varying) allocation changes: we ask what share of the annual budget should be allocated to each intervention in order to meet the objectives, subject to any constraints (see section below). The share of the budget allocated to each intervention is allowed to vary over time, according to a schedule defined by the user (for example, it may be possible to change the allocation every year, or every three years, etc.).
Start-year optimization: rather than varying the share of the budget allocated to each intervention, in this case we seek the optimal timing of making a budget reallocation, subject to any constraints (see section below).
Constraints (i.e., what conditions must be satisfied)?
Constraints limit possible options when optimizing. They serve as requirements that must be met by any proposed solution. The Cascade Analysis Tool has two principal types of constraint:
Constraints on individual adjustments: These typically set minimum or maximum amounts of funding that can be allocated to each intervention independently. These may be constant, or they may vary over time when optimizing scale-up or scale-down scenarios.
Constraining the total budget: there is an overall fixed budget, which is either assumed to be constant over time, or allowed to vary over time (e.g., annually).
Optimization algorithms
After defining the optimization, the tool produces an objective function that can be used to perform the numerical optimization using one of several different algorithms. The Cascade Analysis Tool has built-in support for the following algorithms:
Adaptive Stochastic Descent (ASD) implemented by the sciris Python package. This is a gradient-descent type optimizer that performs well at finding local minima.
Particle swarm optimization (PSO) implemented by the pyswarm Python package. This algorithm is computationally expensive but is more robust than ASD in the presence of multiple local-minima.
Bayesian Optimization implemented by the hyperopt Python package. This method balances exploration of global and local minima, and it is designed to work with expensive objective functions. It is less computationally expensive than PSO and is likely to locate the correct local minimum faster than ASD, although after finding it, it is typically slower to converge to the final optimal solution.
The design of the optimization system facilitates its use with general third-party optimization packages, which makes it easy to switch algorithms and compare different depending on their suitability to the specific problem at hand.
To illustrate the process of creating a model in the Cascade Analysis Tool, we will construct a hypertension cascade. This cascade is included in the library of demonstration projects available in the Cascade Analysis Tool.
To begin, we need to define the structure of the hypertension model. We consider four disease stages – undiagnosed, diagnosed, on treatment, and successfully controlled.
Next, we consider the possible transitions in the model. People begin in the undiagnosed compartment, and then they progress sequentially through the compartments. Once an individual is diagnosed, they cannot lose their diagnosed status, so there is no transition from diagnosed back to undiagnosed. However, an individual on treatment (or with successfully controlled hypertension) may discontinue treatment, so we include a transition from treatment/controlled back to diagnosed to account for this. An individual may die at any stage, so all compartments also have outflows associated with death – typically, the net death rate would be higher for compartments where individuals have untreated hypertension.
Data entry in the databook. We construct a hypothetical example loosely based on a study of 28891 adults in Malawi conducted between May 16, 2013, and Feb 8, 201622, which identified 4096 people with hypertension, of which 1708 were aware of their status, 1183 were receiving treatment, and 440 had controlled blood pressure. We assume these numbers describe the state of the hypertension cascade in 2016 (Figure 4a), and that we want to estimate the state of the cascade in 2017.
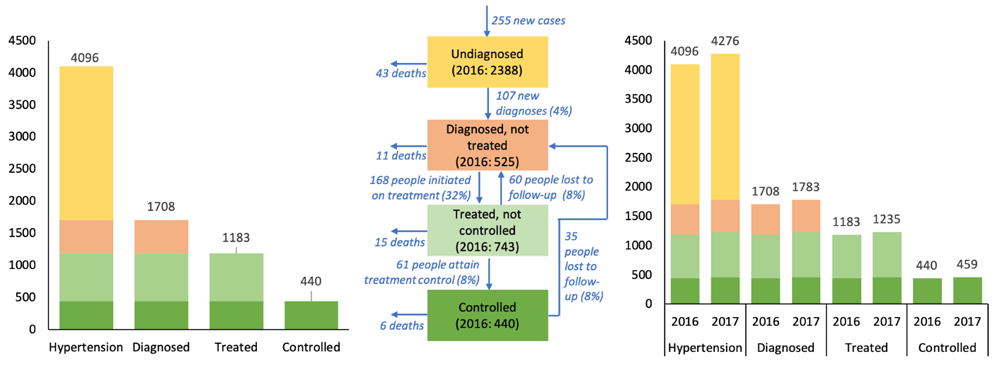
For flow rates, we assume an incidence rate of 72 per 1000 person-years (averaging the values for reported in 23,24), which gives 255 new cases/year. Next, we set the mortality rate to 18.8/1000, reduced to 13.3/1000 for those with blood pressure control (taken from 25), which implies 75 deaths annually among the study population. Combining these estimates of incidence and mortality implies that the total number of people with hypertension increases by 255-75=180 annually, or 4.4%, consistent with an increasing epidemic. We further assume that the hypertension cascade is in a steady state such that the relative proportions of people in each cascade stage are constant over time, which implies that the number of people in each cascade stage will increase by 4.4% each year. This assumption allows us to solve for flow rates between the hypertension care cascade stages over time and to estimate the number of people in each cascade stage in 2017, depicted in Figure 4. These data and assumptions are then entered into the databook (Figure 5).
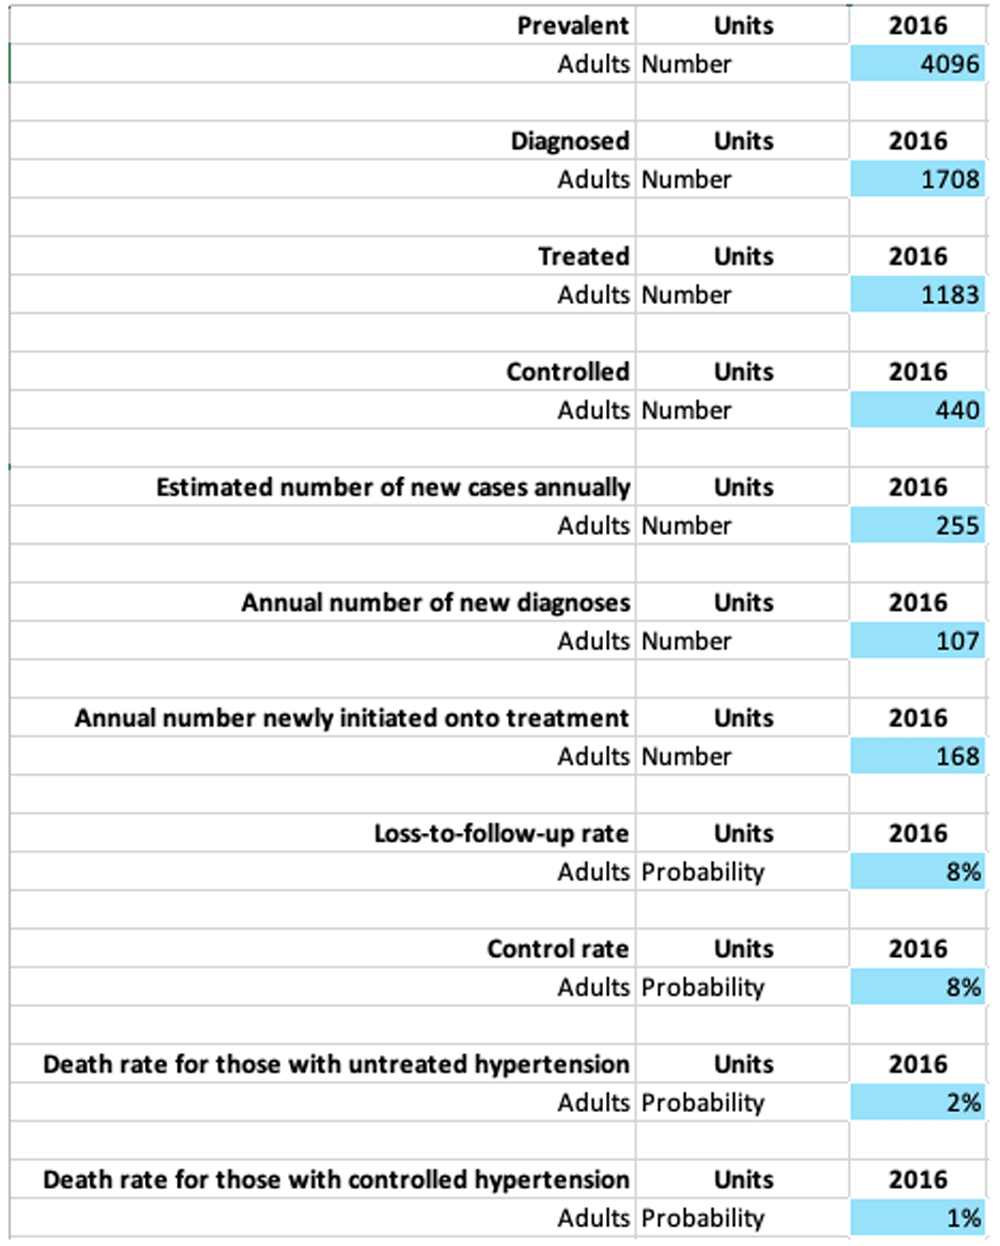
Although we have illustrated values for a single year in this example, the databook supports entering values at multiple time points. Complex models may have many more compartments and parameters, and we have tested the software with highly complex models with ~ 30 compartments and ~150 parameters to verify scalability.
Data entry in the program book. One of the key purposes of a cascade analysis is to understand how various different interventions affect the state of the cascade. In our hypertension cascade example, it would be reasonable to expect that several of the variables that affected the movement of people through the cascade are dependent on interventions that determine the testing, treatment initiation, treatment success, and loss-to follow-up rates.
An essential part of the data collation and curation stage involves assembling a list of the interventions that are likely to have an impact on the cascade. We now illustrate how the programmatic data are used by continuing the hypertension example, supplemented with some assumptions on programmatic data.
We will suppose that people are diagnosed with hypertension after receiving blood pressure tests, and that 2580 such tests were conducted in 2016, either through pharmacies (which we assume provide 55% of tests at a unit cost of $5 and with yield of 3.5%), in clinics (which we assume provide 40% of tests at a unit cost of $20 and with yield of 3.5%), or via an outreach program (which we assume provide the remaining 5% of tests at a unit cost of $15 and with yield of 15%). We suppose that people are initiated onto treatment either immediately after diagnosis (with 20% of those diagnosed at pharmacies, 90% of those diagnosed in clinics, and 70% of those diagnosed via outreach programs being immediately initiated onto treatment), or else people are offered treatment and lifestyle counseling at a unit cost of $25. We also suppose that there is an adherence and lifestyle counseling program to assist those on treatment without blood pressure control (operating at a unit cost of $25 and with 30% of those counseled attaining blood pressure control within 3 months), and retention enhancement initiatives (such as automatic prescription refills, text message reminders for taking medication, or dietary support programs) to counteract loss to follow-up, which increase treatment retention from 88% to 96% at a unit cost per person counseled of $25. Based on what we know about the flow rates through the cascade from Figure 4 and these assumptions about hypothetical programmatic effects, we obtain the programmatic summary documented in Table 1.
| Intervention | Target cascade stage | Number covered | Unit cost | Baseline investment* | Impact |
|---|---|---|---|---|---|
| Pharmacy testing | Undiagnosed | 1,430 tested | $5 | $7,150 | • 50 diagnosed (3.5% yield) • 20% start treatment (10 people) |
| Clinic testing | Undiagnosed | 1,000 tested | $20 | $20,000 | • 35 diagnosed (3.5% yield) • 90% start treatment (32 people) |
| Outreach testing | Undiagnosed | 150 tested | $15 | $2,250 | • 22 diagnosed (15% yield) • 70% start treatment (16 people) |
| Treatment & lifestyle counseling | Diagnosed, not treated | 110 counseled | $25 | $2,750 | • All those counseled start treatment (110 people) |
| Adherence & lifestyle counseling | Treated, not controlled | 200 counseled | $25 | $5,000 | • 30% of those counseled attain blood pressure control within 3 months (60 people) |
| Retention enhancement initiatives | All treated | 600 covered | $25 | $15,000 | • 96% treatment retention vs 88% among those not covered (95 people lost) |
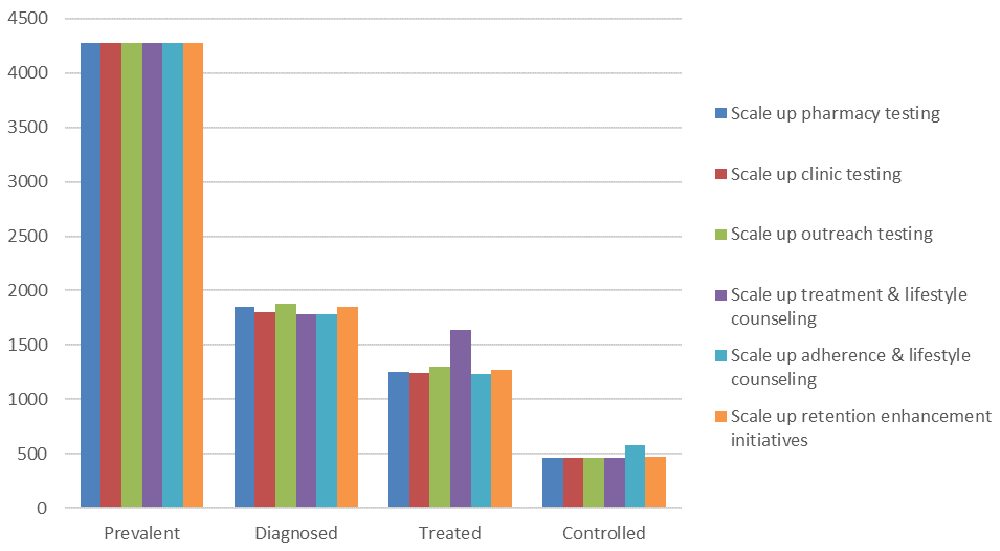
Case scenarios. To illustrate the use of scenarios, we consider six different scenarios in which an additional $10,000 is allocated to each of the six interventions indicated in Table 1 and calculate the impact that this would have on the hypertension cascade introduced in Figure 4. These scenarios are presented in Table 2 and Figure 6.
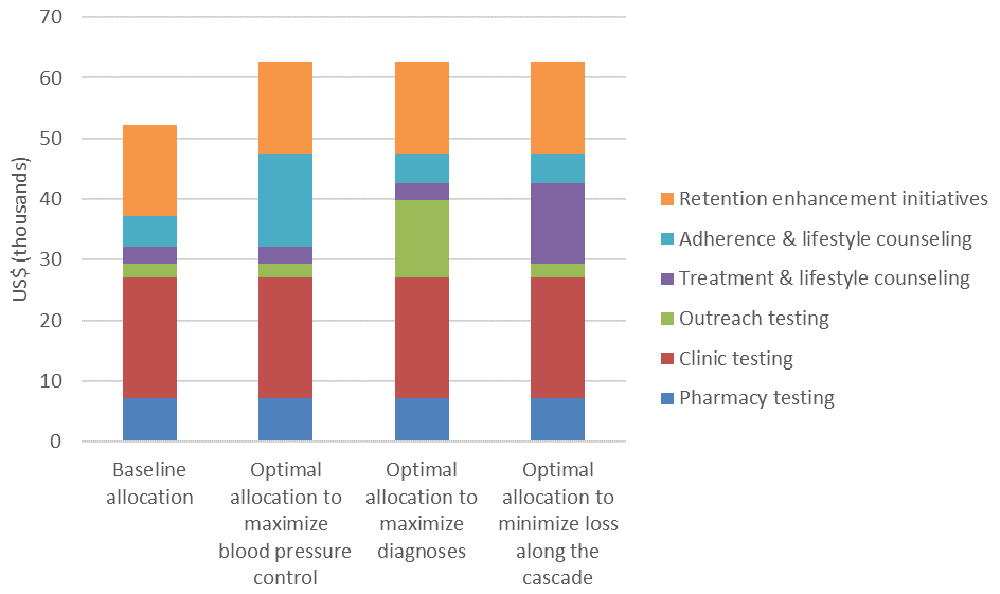
Optimization. The objectives, adjustables, constraints, and optimization algorithms can be flexibly combined by users of the Cascade Analysis Tool. To illustrate the concept of cascade optimization, we return to our hypertension example, where we have an additional $10,000 to improve some cascade outcome. Figure 7 indicates that the best way to spend these additional funds depends on the objective: if we want to maximize the number of people with blood pressure control, the highest priorities are to scale up the adherence & lifestyle counseling program; if we want to maximize the number of people diagnosed, then the outreach testing program is prioritized; and if we want to minimize losses across the whole cascade, the treatment & lifestyle counseling program is prioritized. Here, the adjustment type falls under the heading “immediate one-off allocation change”, since we wish to immediately allocate the additional funds and there are no defined constraints.
We provide three additional examples of optimization problems:
1. The national government is trying to determine an optimal investment strategy for the HIV response in order to get as close as possible to the target of having 86% of people virally suppressed by 2030 (in line with international targets of having 95% of people with HIV diagnosed, 95% of those diagnosed receiving treatment, and 95% of those treated virally suppressed). The country’s treatment program is currently funded by international donors, who have already announced their investment strategy and will begin gradually defunding the treatment program starting in 2021. The government is committed to providing ongoing care for those already on treatment, so the government’s allocation to the treatment will need to increase to match current levels. In this case:
a. the objective is to maximize the number of people in the final stage of the cascade;
b. the adjustment type falls under the heading “ongoing (time-varying) allocation changes”, since the government can change the allocation of funding for the HIV response annually between now and 2030; and,
c. the constraints are the overall budget in each year, plus the additional constraint that the allocation to the treatment program needs to match current levels after international funders have withdrawn.
2. The national government wants to run a large-scale diabetes screening campaign to get 100,000 people screened within the next year. There are several different service delivery modalities for the screening program (e.g., screening through primary health clinics, workplace programs, community outreach programs, and pharmacies). In this case:
The government is considering a program, to be launched in 2022, to improve the overall cascade of care for pregnant women. In this case:
a. the objective might be to minimize losses along the cascade;
b. the adjustment type falls under the heading delayed one-off allocation change”; and,
c. there may be an overall budget constraint, or other defined constraints such as ensuring minimum funding levels for other programs. For example, it could be specified that funding for the new program can only be taken from new funds plus partial redirection of resources from certain programs while not changing funding for others.
The objectives, adjustables, constraints, and optimization algorithms can be flexibly combined by users of the Cascade Analysis Tool.
For complex cascades, it is difficult to determine which programs have the greatest marginal impact. This is especially true when interventions do not target the same populations, do not have the same type of effects, and/or do not have simple linear cost functions. In many cases, the impact of a resource allocation on the cascade may not be known a priori. Moreover, when a large number of interventions are involved, the combinatorial explosion of possible budgets makes it computationally infeasible to explore different possible funding combinations using an undirected approach. Previous studies have already shown that targeting investment to the right combination of effective service delivery modalities across the cascade can lead to greatly improved outcomes21,26. The Cascade Analysis Tool can help make practical recommendations for how to improve cascade outcomes by making use of the increasing quantities of available raw data on the costs, coverage, and impact of health and development interventions. Given the generality of the approach, there is potential for gains to be identified across any number of application areas.
We have taken several steps to encourage the adoption of our framework for cascade analysis. Firstly, we have implemented the processes for using the generalized framework in an Open Access software package, developed in Python and available via GitHub. Secondly, we have included several simple pre-designed cascades in the software package. Thirdly, we have developed a graphical user interface. A website with additional information and a user guide are also available. Finally, we have run three training workshops (in Bucharest, Bangkok, and Pretoria) as part of the World Bank’s 2018 Skills Building Program (themed “Big Data, Artificial Intelligence and Decision Science in Health and Nutrition”), where we trained approximately 100 users (predominantly representatives from ministries of health, development agencies, and local academic institutions).
Whilst the Cascade Analysis Tool is still in the early stages of existence, we believe there is potential for it to help make sense of the increasing quantities of data on cascades. Furthermore, we hope that the existence of this tool will help motivate the collection of even more data, so that results-based evaluation can continue to guide the decision-making processes in health and development in the future.
All data underlying the results are available as part of the article and no additional source data are required.
- Software available at: http://ui.cascade.tools/
- Source code available from: https://github.com/atomicateam/atomica
- Archived source code at time of publication: https://doi.org/10.5281/zenodo.313715427
- License: GNU General Public License v3.0
This work was supported by the Bill and Melinda Gates Foundation [OPP1181918].
The funders had no role in study design, data collection and analysis, decision to publish, or preparation of the manuscript.
| Views | Downloads | |
|---|---|---|
| Gates Open Research | - | - |
|
PubMed Central
Data from PMC are received and updated monthly.
|
- | - |
Is the rationale for developing the new software tool clearly explained?
Yes
Is the description of the software tool technically sound?
Yes
Are sufficient details of the code, methods and analysis (if applicable) provided to allow replication of the software development and its use by others?
Yes
Is sufficient information provided to allow interpretation of the expected output datasets and any results generated using the tool?
Partly
Are the conclusions about the tool and its performance adequately supported by the findings presented in the article?
Partly
Competing Interests: No competing interests were disclosed.
Reviewer Expertise: Population health; Infectious disease epidemiology; Mathematical modeling
Is the rationale for developing the new software tool clearly explained?
Yes
Is the description of the software tool technically sound?
Yes
Are sufficient details of the code, methods and analysis (if applicable) provided to allow replication of the software development and its use by others?
Yes
Is sufficient information provided to allow interpretation of the expected output datasets and any results generated using the tool?
Yes
Are the conclusions about the tool and its performance adequately supported by the findings presented in the article?
Yes
References
1. Subbaraman R, Nathavitharana RR, Mayer KH, Satyanarayana S, et al.: Constructing care cascades for active tuberculosis: A strategy for program monitoring and identifying gaps in quality of care.PLoS Med. 2019; 16 (2): e1002754 PubMed Abstract | Publisher Full TextCompeting Interests: No competing interests were disclosed.
Reviewer Expertise: tuberculosis implementation science, infectious diseases epidemiology
Is the rationale for developing the new software tool clearly explained?
Yes
Is the description of the software tool technically sound?
Yes
Are sufficient details of the code, methods and analysis (if applicable) provided to allow replication of the software development and its use by others?
Partly
Is sufficient information provided to allow interpretation of the expected output datasets and any results generated using the tool?
Yes
Are the conclusions about the tool and its performance adequately supported by the findings presented in the article?
Partly
Competing Interests: No competing interests were disclosed.
Reviewer Expertise: HIV, cascades, global health
Alongside their report, reviewers assign a status to the article:
| Invited Reviewers | |||
|---|---|---|---|
| 1 | 2 | 3 | |
|
Version 2 (revision) 24 Dec 19 |
read | read | read |
|
Version 1 07 Jun 19 |
read | read | read |
Provide sufficient details of any financial or non-financial competing interests to enable users to assess whether your comments might lead a reasonable person to question your impartiality. Consider the following examples, but note that this is not an exhaustive list:
Sign up for content alerts and receive a weekly or monthly email with all newly published articles
Register with Gates Open Research
Already registered? Sign in
If you are a previous or current Gates grant holder, sign up for information about developments, publishing and publications from Gates Open Research.
We'll keep you updated on any major new updates to Gates Open Research
The email address should be the one you originally registered with F1000.
You registered with F1000 via Google, so we cannot reset your password.
To sign in, please click here.
If you still need help with your Google account password, please click here.
You registered with F1000 via Facebook, so we cannot reset your password.
To sign in, please click here.
If you still need help with your Facebook account password, please click here.
If your email address is registered with us, we will email you instructions to reset your password.
If you think you should have received this email but it has not arrived, please check your spam filters and/or contact for further assistance.
Comments on this article Comments (0)