Keywords
PWV, arterial path length, accurate estimation, CT, MPR, Multi planar reformation, Arterial stiffness
PWV, arterial path length, accurate estimation, CT, MPR, Multi planar reformation, Arterial stiffness
Most adult cardiovascular disease begins in childhood1. Given the burgeoning obesity pandemic in children worldwide2, there is a need for precise and scalable surveillance methods to detect subclinical cardiovascular disease in children and adolescents. PWV directly measures artery wall stiffness, an early feature of atherosclerosis. Early detection allows early intervention and intensified primary prevention strategies in affected individuals.
PWV measurement involves measuring the time it takes the arterial pulse to travel a specific distance, and then dividing the distance by the transit time, to calculate the velocity. Transit time is obtained by measuring the interval delay between the pulse wave arriving at a proximal and distal sensor that are placed on fiducial points, most commonly over the external carotid and femoral arteries. Arrival of the pulse wave is identified using various devices that monitor the arterial pressure waveform. These methods of measuring transit time are generally highly reproducible and accurate. However, the distance estimations used for PWV calculation are obtained using a tape measure over the body surface and are vulnerable to error. A variety of methods exist using different surface anatomy landmarks and there is no clarity on the most appropriate method for growing children and adolescents.
Previous studies have highlighted the importance of standardizing methodologies, as the use of different arterial path length estimation methods produce noticeably different results3–5. This makes inter-study comparisons of PWV data very difficult and creates confusion regarding normal values for PWV in children. In adult patients (who are no longer growing in height), any inaccuracy in estimating the distance traveled is irrelevant because the true distance travelled will not change between one visit and the next. Therefore, a change in transit time in adults reliably reflects a change in PWV and thereby indicates progression of arteriosclerotic vascular disease. However, in growing children and adolescents, the distance travelled by the pulse wave may well change between one visit and the next. Therefore, a change in transit time in children or adolescents does not necessarily indicate a change in PWV.
We sought to investigate the fidelity of a variety of arterial path length estimation methods by comparing true arterial path length measured on computerized tomography (CT) scans, with estimations based on a variety of surface anatomy landmarks.
Using the Picture Archiving and Communication System (PACS) at Tygerberg Academic Hospital, Cape Town, we identified all archived CT scans of paediatric and adolescent patients, excluding those with congenital abnormalities of skeleton or any disease likely to distort the gross anatomy of the large vessels. Mid-luminal arterial lengths were measured using the multi-planar reformation (MPR) imaging software Intellispace Portal version 4 (Philips: Amsterdam). Surface anatomy measurements were obtained using the same MPR imaging software. 3D Slicer6, an open source software platform for medical image informatics, image processing, and three-dimensional visualization, with the Vascular Modeling Toolkit (VMTK) extension7 can be used as an alternative to IntelliSpace Portal for computing vessel centerlines and to perform measurements on both surface anatomy and blood vessels.
Comparisons were performed in segments, since there were no whole-body CT scans available. Segments of surface anatomy distances and arterial path lengths are presented in Table 1 and Table 2, respectively. Segment comparisons are tabulated in Table 3. On sagittal, coronal, axial and three-dimensional (3D) volume-rendered images, an experienced operator (LRW) measured the components of the sets of distances presented in Table 3.
| Surface anatomy distance | Arterial path length | |
|---|---|---|
| Set 1 | AS | TC+CB+BE |
| Set 2 | SX | TX |
| Set 3 | XI | XA+AF |
| Set 4 | XU+UI | XA+AF |
| Set 5 | SI | TX+XA+AF |
| Set 6 | SX + XI | TX+XA+AF |
| Set 7 | SX + XU +UI | TX+XA+AF |
Centerline paths of major vessels were created with the Advanced Vascular Analysis (AVA) application within Intellispace Portal, by placing serial markers along the vessel using the axial, sagittal, coronal, and 3D volume rendered images, as per Intellispace Portal operation manual. 3D Slicer with the Vascular Modeling Toolkit (VMTK) extension can be used as an alternative to AVA for computing vessel centerlines. After creating the vessel centerline, the vessel measurements were performed in the “measurement” stage of AVA application. Thereafter the rendering parameters of the 3D volume rendered image were changed to display skin surface to perform the surface anatomy measurement. All distances were measured in millimeters.
In the “vessel extraction” stage of the AVA application, serial markers were placed at the midpoint of the artery lumen, starting at the origin of the brachiocephalic trunk (Figure 1a, b & c) and ending at the external carotid artery at the level of the angle of the mandible (a common PWV recording site in the neck), using the axial, coronal and sagittal images. Markers were placed at approximately 10mm intervals. In the “measurement” stage of the of the AVA application, the length of the vessel centerline from the brachiocephalic trunk to the external carotid artery at the angle of the mandible was measured (Figure 2a & b).
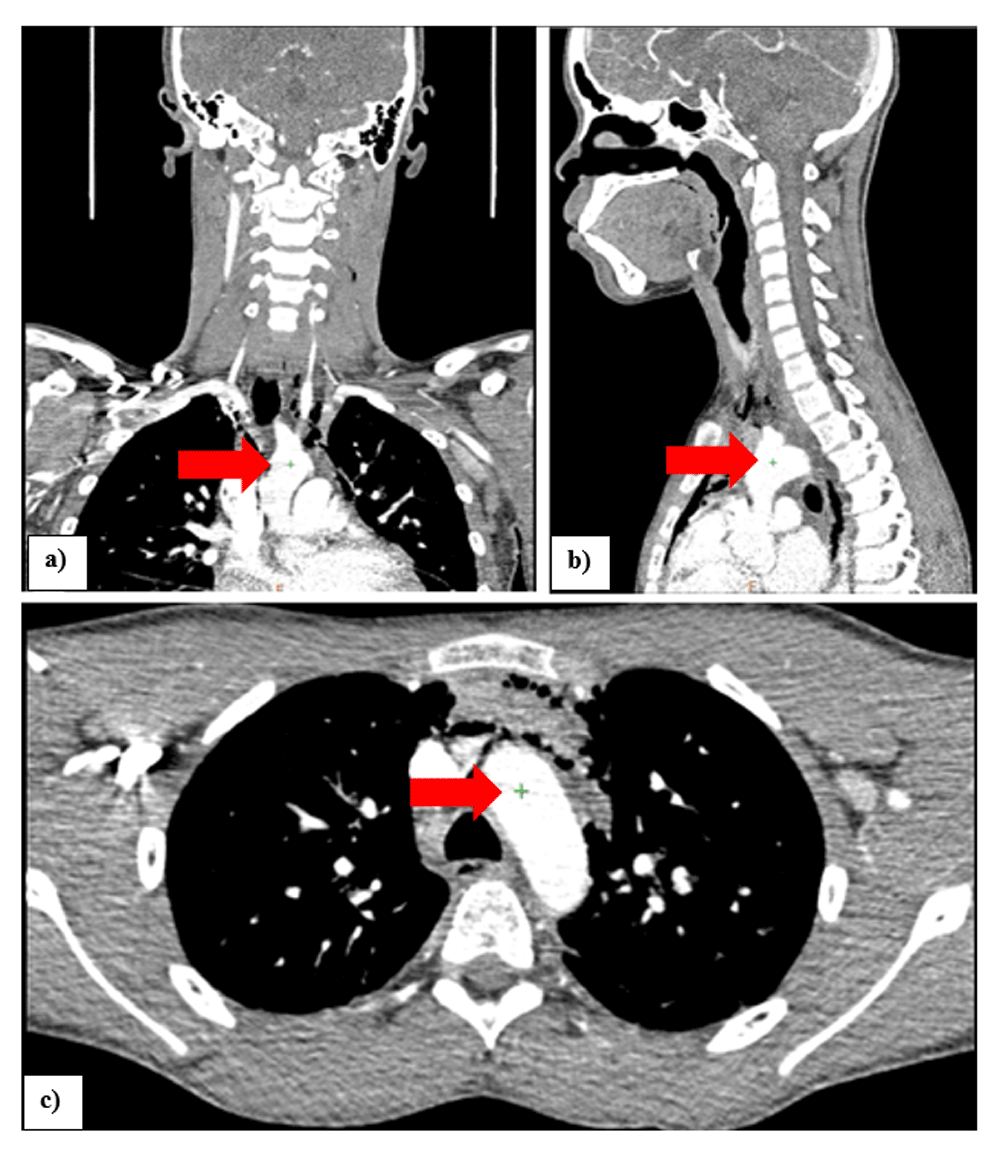
Illustrating the placement of the first marker (seed) on the coronal (a), sagittal (b) and axial (c) images, for measurements starting at the origin of the brachiocephalic trunk.
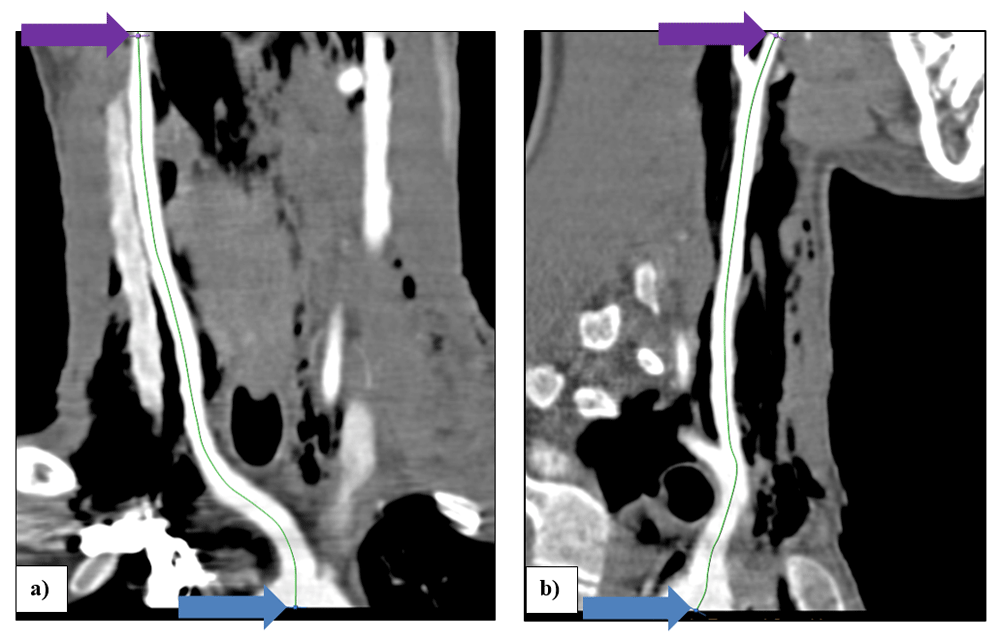
Illustration of vessel centerline TC+CB+BE on a curved coronal (a), and on a curved sagittal (b) MPR. The blue arrows point to the start of the vessel measurement at the origin of the brachiocephalic trunk and the purple arrows point to the end of the measurement in the right external carotid artery at the level of the angle of the mandible.
A similar method was used to measure the arterial path length TX+XA+AF. This is illustrated in the Extended data (Figure 7)8.
Continuing in the “measurement” stage, the rendering parameters of the volume rendered image were changed to display skin surface. Thereafter the “magic glass window” feature was selected from the right click menu. This “magic glass window” feature is an enhanced visualizing window that can be superimposed on top of the volume rendered image of the skin surface. It is a moveable mini-window which can be set with its own windowing, image enhancement and rendering parameters to enable the operator to “look through” the skin at the anatomical structures beneath. The rendering parameters inside the active “magic glass window” were adjusted to visualize the precise position of the underlying supra-sternal notch (Figure 3a) and the angle of the mandible (Figure 3b). The surface distance between these two points was then measured with the volume rendered image rotated 45 degrees to the right as shown in Figure 4a. Thereafter the volume rendered image was turned 90 degrees (lateral) as shown in Figure 3b to check the measuring line placement on the face (angle of the mandible) and then to the antero-posterior position to check the measuring line placement on the supra-sternal notch as shown in Figure 3a.
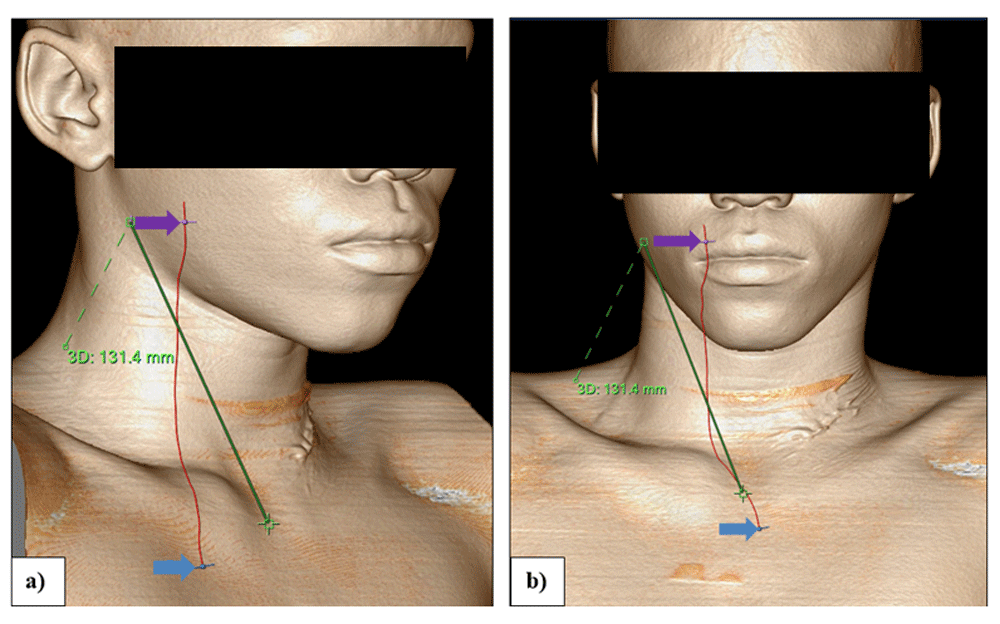
Illustrating surface measurement AS on an anterior-posterior 3D volume rendered image (a) and a lateral 3D volume rendered image (b), using the “magic glass window”. The green line represents the surface anatomy distance between the angle of the mandible and the suprasternal notch. Also visible is the vessel centerline TC+CB+BE constructed in Figure 4: The blue arrows point to the start of the vessel measurement TC+CB+BE at the origin of the brachiocephalic trunk and the purple arrows point to the end of the measurement in the right external carotid artery at the level of the angle of the mandible.

Illustrating surface measurement AS on an oblique 3D volume rendered image (a) and an anterior-posterior 3D volume rendered images (b), after the “magic glass window” has been removed. As before, the blue arrows point to the start of the vessel measurement TC+CB+BE at the origin of the brachiocephalic trunk and the purple arrows point to the end of the measurement in the right external carotid artery at the level of the angle of the mandible.
A similar method was used to measure the other surface anatomy distances. These are illustrated in the Extended data (Figures 8 to 10)8.
Ethical approval was sought from Health Research Ethics Committee of Stellenbosch University (Ethics Reference #: S15/05/113). A retrospective collection of CT scans between January 2010 and May 2018 were used. Since the images were part of an archive database, there was no direct interaction with patients and a request for a waiver of individual informed consent was approved from the ethics committee. Personal information was kept strictly confidential and identifying demographic information was not captured.
There is excellent correlation between all surface anatomy distances and the arterial path lengths they represent (see Table 4). However, the surface anatomy distances and the arterial path lengths are not equal; they require mathematical conversion using the linear regression equation shown on their respective scatterplots. Figure 5 and Figure 6 show scatterplots of Comparison Set 1 and Comparison Set 5, respectively. Scatterplots of the other Comparison Sets are provided in the Extended data (Figures 11 to 15)8.
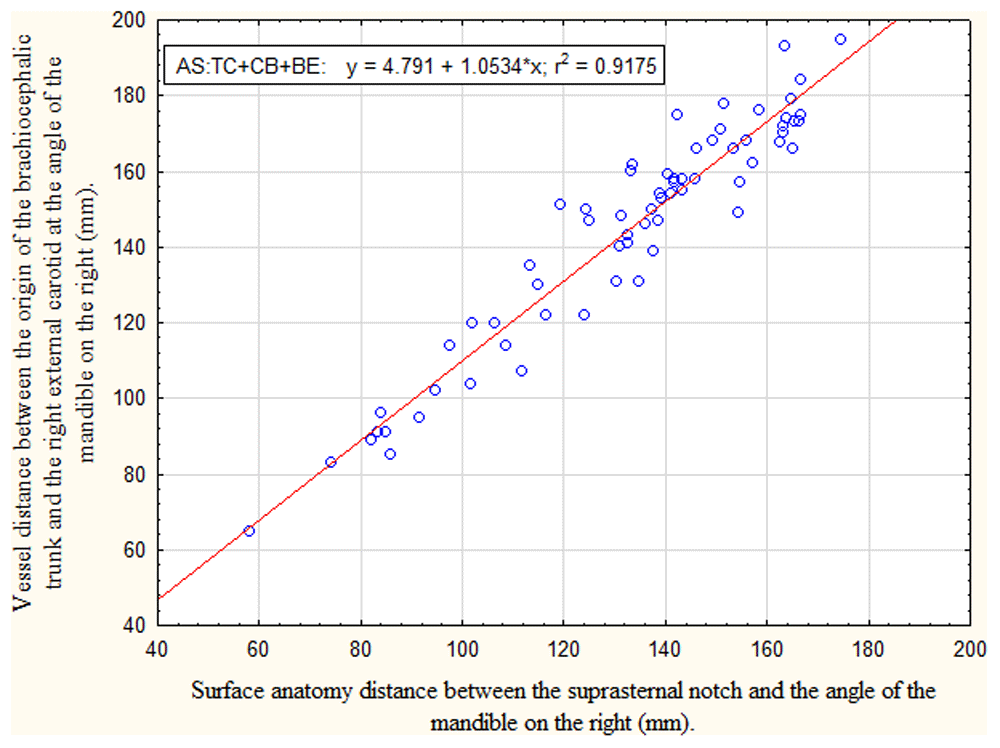
Relationship between arterial path length TC+CB+BE (origin of the brachiocephalic trunk to the external carotid at the angle of the mandible on the right) and surface anatomy distance AS (suprasternal notch to the angle of the mandible) in children younger than 18 years. Linear regression analysis showed a strong positive correlation (r2 =0.92). The regression equation to be used for mathematical conversion is presented in the block insert.
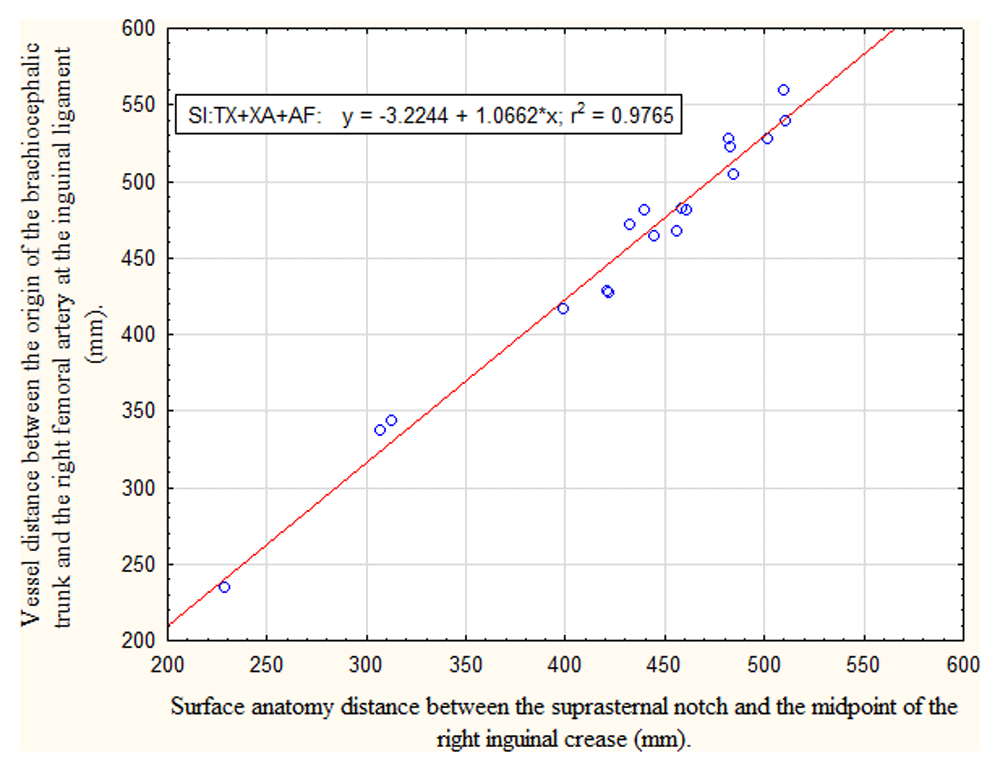
Relationship between arterial path length TX+XA+AF (origin of the brachiocephalic trunk to the right femoral artery at the inguinal ligament) and the surface anatomy distance SI (suprasternal notch to the midpoint of the right inguinal crease) in children younger than 18 years. Linear regression analysis showed a very strong positive correlation (r2 =0.98). The regression equation to be used for mathematical conversion is presented in the block insert.
The age range and gender split for each Comparison Set is presented in the Extended data (Table 5 and Figure 16)8.
The aim of the current study was to estimate the true intraluminal distance travelled by the pulse wave, which is equal to:
This may be estimated using the following component surface anatomy distances:
(TC+CB+BE) is accurately estimated by (AS), provided the surface anatomy distance (AS) undergoes mathematical conversion using the linear regression equation presented in the block insert on the Figure 5 scatterplot. Without the mathematical conversion, the surface anatomy distance (AS) consistently underestimates the true arterial path length (TC+CB+BE) by -8% to -12%.
(TX+XA+AF) is accurately estimated by the sum of the surface anatomy distances (SX) plus (XU+UI). Without the mathematical conversion using the linear regression equations presented in the block inserts on Figures 11 and 13, this combination of surface anatomy distances minimally over- or under-estimates the arterial path length (TX+XA+AF) by +2% to -1%.
(TX+XA+AF) is less accurately estimated by the sum of the surface anatomy distances (SX) plus (XI). Without the mathematical conversions using the linear regression equations presented in the block inserts on Figures 11 and 12, this combination of surface anatomy distances underestimates the arterial path length (TX+XA+AF) by -1% to -3%.
(TX+XA+AF) is even less accurately estimated by the surface anatomy distance (SI). Without the mathematical conversion using the linear regression equation presented in the block insert on Figure 6, the surface anatomy distance (SI) consistently underestimates the arterial path length (TX+XA+AF) by -5% to -6%.
Therefore, the true intraluminal distance travelled by pulse wave is most simply and reliably estimated by subtracting the adjusted surface anatomy distance between the suprasternal notch and the angle of the mandible (PWV recording site in the neck), from the unadjusted distance from the suprasternal notch to the umbilicus, through the mid-inguinal crease to the femoral PWV recording site. Substitution using the surface anatomy distances (SI), or (SX) plus (XI) may require mathematical conversion to retain reasonable accuracy.
The issue of accurate PWV measurement in growing children and adolescents is a crucial one, given the burgeoning obesity pandemic in children worldwide2 and the corresponding need for precise and scalable surveillance methods to detect subclinical cardiovascular disease in that population group. The present study was designed to investigate the most accurate method of estimating the true distance travelled by the aorto-femoral pressure wave, using surface anatomy landmarks in growing children, allowing accurate calculation of carotid-femoral PWV.
PWV directly measures increasing arterial wall stiffness, a valuable precursor to atherosclerosis9. Identifying progressive vascular disease early in its pathogenesis allows for early intervention to prevent progression. Automated PWV offers affordable and scalable surveillance for monitoring and identifying the early stages of arteriosclerosis.
The main finding of our study was that, although there is excellent correlation between the surface anatomy distances and their respective arterial path lengths, surface anatomy measurements require adjustment using the conversion formulae that we have provided, to accurately estimate the true distance travelled by the pulse wave. An exception may be the surface anatomy distances (SX) and (XU+UI), which differ minimally from the arterial path lengths they represent.
The combination that most accurately estimates the true distance travelled by the aorto-femoral pressure wave are the surface anatomy distances (SX) plus (XU+UI) minus (AS). The distance (AS) needs to be mathematically converted (using the linear regression equation presented in the block insert on the Figure 6 scatterplot) since the arterial path in the neck is more tortuous than the aorta. The correlation between SX and TX was not as strong as the other comparisons (r2 = 0.84 versus 0.92 – 0.99); the reason for this may be related to morphological variability in aortic arch anatomy or the different age range of participants (median 6 versus 13 – 15 years of age). When this distance is combined with others into longer sections (such as SX+XI and TX+XA+AF), the magnitude of the error is reduced and correlations improve.
Our study is entirely novel in that, to the best of our knowledge, it is the first published attempt at investigating this question in growing children and adolescents. It is not surprising that our results are inconsistent with previous studies performed in adults4,5,10–12, since the bodies of growing children and adolescents are different in proportion and shape to adults.
Our data will result in more reliable PWV calculation in growing children and adolescents. More robust and accurate measurement of PWV will in turn enable healthcare workers to detect arterial stiffness in its early stages and allow for early interventions to prevent vascular events such as strokes and heart attacks later in life. Finally, our findings will enable more robust inter-study comparisons of carotid-femoral PWV data in children and adolescents.
Note that the surface distances obtained in the current study are equivalent to the distances one would find when using a sliding caliper. Therefore, the exaggerations of surface anatomy measurements caused by morbid obesity may be overcome by using a sliding caliper instead of a tape measure13.
Our study had several limitations. First, although our results showed a very strong correlation between the surface anatomy measurements and their respective arterial path length measurement, the sample size was limited, particularly for comparisons requiring long scans stretching from the neck to the pelvis. We overcame this by comparing subsections of arterial path length (e.g. SX compared to TX; and XI compared to XA+AF).
Second, the surface anatomy measurements were performed using 3D volume rendered images. In a future study, the surface anatomy measurement could be performed on actual patients face-to-face, and then compared to the arterial path length obtained from CT imaging.
Third, we were unable to determine whether there were any systematic ethnic differences in the measurements, because ethnicity information was not available.
Fourth, although we measured the length of the centerline of large vessels, we did not measure the internal diameter of the vessel, which may confound the speed at which the aorto-femoral pressure wave travels. The latter was beyond the scope of the present study.
There is high correlation between the surface anatomy distances and the arterial path lengths they represent; however, these are not equal. Most surface anatomy measurements require adjustment using the formulae that we have provided, to accurately estimate the true distance travelled by the pulse wave.
Due to the large number of CT scans used (n=483) in this study and the size of these DICOM files that can be as big as 2.5 Gigabytes per scan. It is not feasible to share these data sets.
A reader/reviewer can request a copy of the data sets by submitting an application to the Tygerberg hospital research committee, specifically to Mrs. Dawn Marwood (Dawn.Marwood@westerncape.gov.za Tel: +27 21 938 5966). In addition, an online application to the National Health Research Database (https://nhrd.health.gov.za/) is also required.
Figshare: DATA: Accurate arterial path length estimation for pulse wave velocity calculation in growing children and adolescents. https://doi.org/10.6084/m9.figshare.1278398014.
This project contains underlying path length measurements in the following files:
Figshare: EXTENDED DATA: Accurate arterial path length estimation for pulse wave velocity calculation in growing children and adolescents. https://doi.org/10.6084/m9.figshare.12783848.v18.
Data are available under the terms of the Creative Commons Attribution 4.0 International license (CC-BY 4.0).
| Views | Downloads | |
|---|---|---|
| Gates Open Research | - | - |
|
PubMed Central
Data from PMC are received and updated monthly.
|
- | - |
Is the work clearly and accurately presented and does it cite the current literature?
Partly
Is the study design appropriate and is the work technically sound?
Yes
Are sufficient details of methods and analysis provided to allow replication by others?
Yes
If applicable, is the statistical analysis and its interpretation appropriate?
Partly
Are all the source data underlying the results available to ensure full reproducibility?
Yes
Are the conclusions drawn adequately supported by the results?
Yes
References
1. Kracht D, Shroff R, Baig S, Doyon A, et al.: Validating a new oscillometric device for aortic pulse wave velocity measurements in children and adolescents.Am J Hypertens. 2011; 24 (12): 1294-9 PubMed Abstract | Publisher Full TextCompeting Interests: No competing interests were disclosed.
Reviewer Expertise: Pediatric hypertension, pediatric CKD, pediatirc pransplantation, cardiovascular consequences of CKD in childhood
Is the work clearly and accurately presented and does it cite the current literature?
Partly
Is the study design appropriate and is the work technically sound?
Yes
Are sufficient details of methods and analysis provided to allow replication by others?
Yes
If applicable, is the statistical analysis and its interpretation appropriate?
Partly
Are all the source data underlying the results available to ensure full reproducibility?
Yes
Are the conclusions drawn adequately supported by the results?
Partly
References
1. Reference Values for Arterial Stiffness' Collaboration: Determinants of pulse wave velocity in healthy people and in the presence of cardiovascular risk factors: 'establishing normal and reference values'.Eur Heart J. 2010; 31 (19): 2338-50 PubMed Abstract | Publisher Full TextCompeting Interests: No competing interests were disclosed.
Reviewer Expertise: Arterial stiffness in adults, especially hypertension
Alongside their report, reviewers assign a status to the article:
| Invited Reviewers | ||
|---|---|---|
| 1 | 2 | |
|
Version 1 27 May 21 |
read | read |
Provide sufficient details of any financial or non-financial competing interests to enable users to assess whether your comments might lead a reasonable person to question your impartiality. Consider the following examples, but note that this is not an exhaustive list:
Sign up for content alerts and receive a weekly or monthly email with all newly published articles
Register with Gates Open Research
Already registered? Sign in
If you are a previous or current Gates grant holder, sign up for information about developments, publishing and publications from Gates Open Research.
We'll keep you updated on any major new updates to Gates Open Research
The email address should be the one you originally registered with F1000.
You registered with F1000 via Google, so we cannot reset your password.
To sign in, please click here.
If you still need help with your Google account password, please click here.
You registered with F1000 via Facebook, so we cannot reset your password.
To sign in, please click here.
If you still need help with your Facebook account password, please click here.
If your email address is registered with us, we will email you instructions to reset your password.
If you think you should have received this email but it has not arrived, please check your spam filters and/or contact for further assistance.
Comments on this article Comments (0)