Keywords
pulmonary tuberculosis, drug sensitive, predict tb, PET/CT, treatment shortening
pulmonary tuberculosis, drug sensitive, predict tb, PET/CT, treatment shortening
Multiple clinical trials over the last 40 years attempting to shorten therapy for pulmonary, drug-sensitive tuberculosis from six to four months have failed1–4. Despite this, the various four-month treatment arms consistently cured about 80–85% of patients. The premise of the ongoing PredictTB clinical trial is that this sub-population of lower risk patients who are cured at four months can be identified prospectively5. Two subsequent secondary analyses of the three fluoroquinolone treatment shortening trials2–4 support this premise by finding that a subset of lower risk participants, those without cavity on baseline chest-x-ray, acid-fast bacilli (AFB) smear less than 2+ at baseline, or AFB smear negative at month 2 of treatment were associated with successful four-month treatment outcomes6,7. Another trial prospectively attempted a similar risk stratification by shortening treatment for those without cavity on baseline chest x-ray, a measure of baseline risk, and those with negative sputum cultures at two months of treatment, a measure of treatment response8. Although this trial also failed, the treatment success rate in the four-month arm achieved 93%, higher than other four-month treatment trials that did not risk stratify participants. The PredictTB trial was developed on the hypothesis that more precise methods of evaluating baseline risk and treatment response will successfully identify lower risk participants cured with four months of treatment.
The value of early chest x-ray changes to predict TB treatment outcomes has been recognized for over 60 years9. Cavities on baseline chest x-ray10–12 and residual cavity at cure13 have been associated with poor treatment outcomes. Computed tomography scans are more sensitive than x-ray. Further, changes on 2-deoxy-2-[18F]fluoro-D-glucose (FDG)-positron emission tomography/computed tomography (PET/CT) scans have been associated with treatment outcomes in nonhuman primates14,15. Results in patients have been limited to small numbers due to the difficulty of collecting PET/CT imaging in this setting. However, a study of patients with pulmonary, multidrug-resistant tuberculosis (MDR-TB) showed a relationship with long-term treatment outcomes16. In drug sensitive TB (DS-TB), distinct response patterns on PET/CT scan from baseline to month 6 on treatment correlated with treatment outcomes17.
Month 2 sputum culture conversion has traditionally been considered the best biomarker of treatment outcome available18 despite a meta-analysis demonstrating poor sensitivity and specificity in predicting outcomes19. This has been confirmed by additional analyses of the REMoxTB treatment shortening trial2, where month 2 culture conversion status poorly predicted final outcomes20. Time-delays associated with culture conversion tests can be as long as 6-8 weeks, resulting in delayed assessments of the patient’s bacillary status. Immediately available test results are likely to predict outcomes better than delayed results because the results reflect the patient’s current status rather than a historical status from 1-2 months ago and thus poor results can be acted upon immediately. The value of contemporaneous results has been shown with CD4 cell counts in HIV21, as well as in TB where a month 6 culture conversion status predicted final outcomes significantly better than month 2 culture conversion status22. A point-of-care test that measures TB bacterial load has the potential to predict outcomes better than a delayed culture conversion result.
The aim of this analysis is to describe how the early treatment completion criteria used in the ongoing PredictTB clinical trial (NIH IRB #16IN133; NCT02821832) were developed. In this analysis, we assess the relationship between measures of baseline risk and treatment response with poor treatment outcomes in a cohort of pulmonary DS-TB patients treated programmatically in South Africa. Baseline risk is assessed using quantitative markers from FDG-PET/CT scans at baseline. Early treatment response is assessed by changes in these markers on FDG-PET/CT scan at week 4 of treatment. Adherence is also assessed, as is a quantitative measure of residual bacterial load using sputum Xpert MTB/RIF cycle threshold at week 16.
The dataset we used to develop our algorithm were the PET/CT scans (DICOM format), the Xpert MTB/RIF cycle threshold values, and the final treatment outcomes from a cohort of 92 pulmonary DS-TB patients treated programmatically in Cape Town, South Africa with PET/CT scans performed at baseline, week 4, and at the end-of-treatment (Catalysis cohort; end-of-treatment scans not used in this analysis)17. Ninety-nine participants were included in the original study but seven participants did not have a complete set of PET/CT scans, Xpert MTB/RIF cycle threshold results, and treatment outcomes available. Data were collected under written informed consent and the study was reviewed by the Stellenbosch University ethics committee (approval number N10/01/013). The Catalysis cohort dataset used for this analysis was de-identified and no additional ethical approval was required. We developed a risk stratification algorithm for the PredictTB trial5 that predicted participants who would successfully complete TB treatment early at four months (compared to the standard six months) with the following aims: 1) capture all treatment failure and recurrent TB patients as high risk; and 2) stratify 50% of all patients as low-risk. Although previous four-month treatment trials consistently cured 80-85% of patients, we conservatively lowered this estimate to target 50% of patients as eligible for treatment shortening. Patients included in this analysis from the Catalysis cohort were contacted at ≥1 year after treatment completion for final treatment outcomes, including cures, treatment failures, and retreatments. Retreatment outcomes were defined programmatically as patients who restarted TB treatment for any reason and may include true relapses, re-infections, or nontuberculous infections with symptoms that mimic TB. Culture confirmation was not routinely obtained nor was mycobacterial genetic strain-typing performed to differentiate relapse from re-infection.
We patterned our risk stratification algorithm on the Johnson et al. trial that, although was stopped early by its Data and Safety Monitoring Board as a failure, increased the treatment success rate in the four-month arm to 93%8. This study used a measure of baseline disease burden (cavity on baseline chest x-ray) as well as a measure of treatment response (sputum culture conversion at week 8). For baseline disease burden, we used disease severity measured on PET/CT scan. For treatment response, we measured change in disease severity on the week 4 PET/CT scan. As we developed the specific risk stratification algorithm thresholds, it became clear that we would not be able to accomplish both aims simultaneously. Any algorithm sensitive enough to capture all unfavorable outcomes as high risk was poorly specific, with well below 50% remaining as low risk. Any algorithm specific enough to capture 50% as low risk was not sensitive enough to capture all or nearly all unfavorable outcomes as high risk. We realized that we could not capture all treatment failure and retreatment patients as high risk in our risk stratification algorithm because some patients who failed may have failed due to patient-related factors, such as poor treatment adherence, that we could not predict because we only had adherence data based on monthly pill counts, which can be inaccurate23,24. For example, a patient with less severe baseline disease and a good response after one month of treatment and therefore predicted to be low risk may subsequently fail treatment due to poor adherence after the initial month of therapy. Retreatment TB patients were even more complex because, in addition to the possibility of poor adherence, retreatment TB was defined as programmatic restart of TB treatment by the local TB clinic for any reason. In most cases, retreated patients were not confirmed as true TB by culture, which also prevented strain typing to differentiate relapse with the same strain from re-infection with a different strain. Re-infection contributed to about 50% of recurrent TB cases in a previous analysis from Cape Town25 and may not be differentiated from relapse in an algorithm based on radiology. A rigorous analysis of risk criteria would have required a larger prospective dataset of cures, treatment failures, and confirmed relapses with PET/CT scans to facilitate model training, testing and validation. Because of these limitations of the Catalysis dataset for our purposes, particularly our lack of clearly defined poor treatment outcomes, we shifted our aims to emphasize: 1) stratifying about 50% of the cohort as low-risk and eligible for treatment shortening, while 2) capturing as many treatment failures over retreatments as possible because failures were felt to be more reliably determined than retreatments.
Each PET/CT scan was read using MIM software version 6 (MIM Software Inc, Cleveland, Ohio USA; freely available alternatives include ITK-SNAP, 3D Slicer, and MeVisLab), with all diseased areas of the lung included in regions of interest (ROI). Data exported from each scan included cavity air measurements and Hounsfield unit (HU) histograms of volumes of each ROI on CT scans and total lesion glycolysis (TLG) for each ROI on PET scans. Hounsfield units are a measure of density, with air about -1000 HU, normal lung around -700 to -950 HU, water at 0 HU, and bone ranging from +500 to +1000 HU. TB lesion density ranges from near normal lung to about +200 HU, with dense consolidations measuring around -100 to +200 HU. As there are few other densities in this “hard” region in normal lung (for example, blood vessels), the volumes measured in this range almost completely represent TB lesion density so we focused on this “hard” HU range for this analysis (compared to “softer” TB lesions below 100 HU). For PET scans, we determined total lesion glycolysis (TLG) in diseased lung regions, which is a measure of the amount of FDG uptake and is calculated by the mean standardized uptake value in each lung region multiplied by the volume of that region. However, neither CT hard volume nor PET TLG have previously been validated as markers of treatment outcome in TB, whereas previous studies have found chest x-ray cavity size to correlate with unfavorable outcomes10–12. Therefore, for this analysis, cavity air volume measured at baseline and change in cavity air at week 4 were weighted more heavily than CT hard volume and PET TLG.
In addition to PET/CT scan quantitation, two other variables were incorporated into the risk stratification algorithm. Instead of the month 2 sputum culture traditionally used to predict treatment outcome, the Xpert MTB/RIF cycle threshold assay at week 16 was included in our early treatment completion algorithm. Xpert MTB/RIF correlates well with sputum smear and culture results, with excellent sensitivity but poor specificity26. When the assay cycle threshold is incorporated, the balance between sensitivity and specificity improves correlations with sputum smear27,28 or culture29. We applied this test at week 16 as a measure of residual bacterial load at the time of potential treatment completion because this is a point-of-care test with immediate results. The second variable incorporated at week 16 is an adherence dose count requirement of about 90% (minimum 100 out of possible 112 doses [7 doses/week x 16 weeks]) because at least 90% has been correlated with better treatment outcomes6,30.
Statistical analyses were conducted in R (version 3.6.1). Primary analyses compared tested imaging markers (cavity air, hard volume, and TLG) measured at baseline and one-month after treatment initiation between cures vs failures (and retreatments) using Wilcoxon rank-sum tests. As an exploratory analysis with limited statistical power, statistical significance was defined by p <0.05, without adjustment for multiplicity. Non-parametric receiver operating characteristic (ROC) curves were generated using R packages, pROC and ROCR31,32. Sensitivity and specificity estimates were computed as binomial proportions, along with 95% confidence intervals using a normal approximation.
Among the 92 patients that we analyzed from the Catalysis cohort, 73 were cured (asymptomatic two years after the end of treatment), eight failed treatment, and 11 programmatically restarted TB treatment during follow-up. For the PET/CT imaging analysis, the baseline and week 4 PET/CT scans were each read by a single reader, with overall summary statistics presented in Table 1. At baseline, cured patients were significantly different from treatment failure patients in CT cavity air volume, with CT hard volume and PET TLG differences being borderline significant (P=0.059 for both). At week 4, only the difference in total cavity air remained significantly different. In contrast, the results for patients who were cures and retreatments were not significantly different from each other in any parameter at baseline or at week 4, making it very difficult to differentiate these two cohorts using these parameters. The comparison of treatment failures with retreatments was similar to that of treatment failures with cures. We therefore developed our criteria based primarily on differences between the cured and failure cohorts.
Wilcoxon rank-sum test was performed to assess the difference in image features by outcome groups.
To identify specific thresholds that predicted cure vs treatment failure, ROC curves were drawn for each variable (Figure 1). When using the optimal ROC thresholds of all baseline and week 4 PET/CT criteria into a single algorithm, the combined criteria predicted cure with 100% sensitivity, capturing all eight failures and 11 retreatments as high risk. However, specificity was very poor at 19.2% and only 14/81 (17.3%) of subjects with both baseline and week 4 PET/CT scans were classified as low risk (Table 2). This is well below our target of 50%, classifying too many as false positive high risk, resulting in an algorithm that is neither practical nor scalable. We therefore adjusted the thresholds to be more specific at the cost of sensitivity to approach our 50% target.
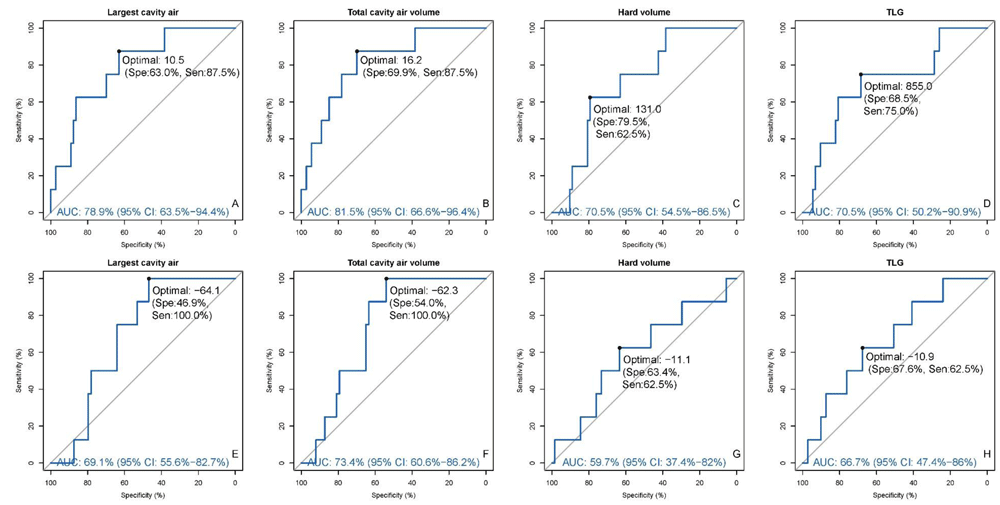
Panel A–D: baseline; Panel E–H: %change of week 4 from baseline; AUCs along with 95% CIs were added as blue text at the bottom of each plot; optimal threshold and the corresponding sensitivity and specificity were labeled on the curve. ROC, receiver operating characteristic; AUC, area-under-the-curve; CI, confidence intervals; TLG, total lesion glycolysis.
Because prior clinical trials data already demonstrated that baseline cavity was a risk factor for poor outcomes8,10, and because cavity size was the strongest predictor of poor outcome in our ROC curves (cavity air area-under-the-curve (AUC) > CT hard volume and PET TLG AUCs), we built the algorithm around this parameter first. We defined cavity as largest single cavity size rather than total cavity size because we posited that a single large cavity induced higher risk and may take longer to heal than multiple smaller cavities (i.e. one 30 mL cavity had a higher risk for poor outcome than two 15 mL cavities). In examining the baseline cavity size threshold, a 10.5 mL threshold captured 6/8 (75%) of treatment failures as high risk but only 46/73 (63.0%) cures as low risk. By increasing the threshold to 30 mL, the algorithm would miss one additional failure (now only 5/8 [62.5%] as high risk; increasing beyond 30 mL would lose more than one additional failure) but specificity would increase to 86.3% (63/73 cures now classified as low risk; Table 3). Overall, using 30 mL instead of 10.5 mL as the baseline cavity threshold increases the proportion of cured (N=73) and failure (N=8) patients defined as low risk from 48/81 (59.3%) to 66/81 (81.5%). Changing the week 4 cavity volume reduction threshold from 64% to 20% results in a similar sensitivity/specificity tradeoff. After applying both baseline and week 4 cavity change thresholds, only 29/81 (35.8%) would have been classified as low risk (before adding any other imaging criteria) using the 64% threshold but 58/81 (71.6%) were low risk with the 20% cavity reduction threshold (Table 3). In contrast to prior data on the risk from baseline cavities, quantitation of CT disease volumes and PET TLG has not previously been validated. Therefore, weighing cavity size to threshold about half (28.4% of total) of the target 50% as high risk seemed appropriate, allowing the remaining criteria (CT hard volume, PET TLG, Xpert cycle threshold, and adherence) to threshold the other half.
Similar to the cavity size thresholds, the cutoffs for hard CT volume and PET TLG were adjusted by decreasing sensitivity but increasing specificity from the optimal ROC parameters (Figure 1, Table 2) to stratify about 50% of the total cohort as low risk, aiming to capture as many treatment failure and retreatment patients as possible within the 50%. Figure 2 demonstrates the patient stratifications when baseline CT hard volume <200 mL and TLG <1500 units were used as low risk criteria at baseline. When combined with largest cavity air <30 mL, 60/81 (74.1%) patients were classified as low risk at baseline (Table 4). When applied to the entire Catalysis cohort, including the retreatment patients, 6/8 (75%) failures but only 1/11 retreatments were classified as high risk at baseline, suggesting that treatment failure patients may be more correlated with severity of baseline disease compared to retreatment TB patients. Week 4 change criteria for CT hard volume and PET TLG were similarly adjusted and allowed for slight increases to account for potential paradoxical treatment responses that were ultimately still favorable. The final week 4 criteria selected allowed up to a 10% increase in hard volume and 30% increase in TLG at week 4 to remain low risk, resulting in 46/81 (56.8%) classified as low risk after applying both baseline and week 4 PET/CT criteria (Table 4). The week 4 criteria captured only one additional failure but two additional retreatments, suggesting that retreatment TB patients may be more correlated with poor treatment response at week 4 rather than severity of disease at baseline.
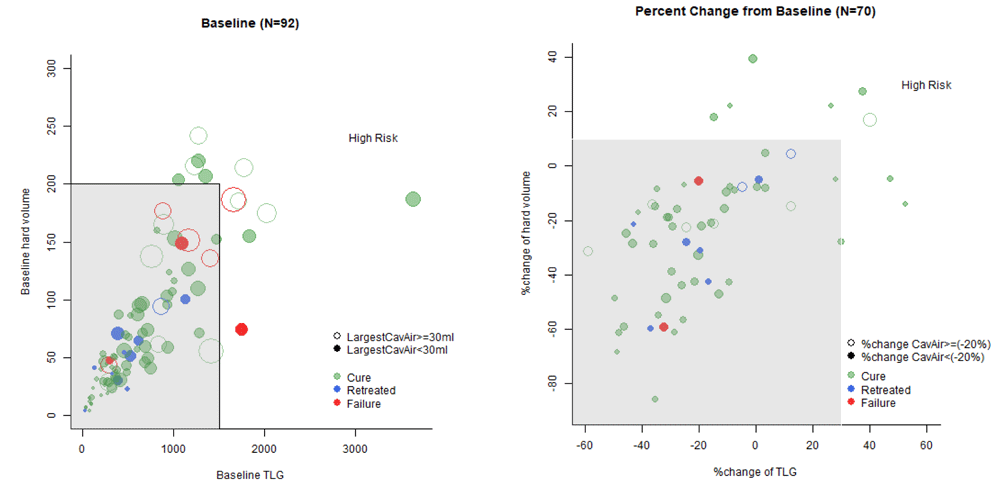
Left: baseline; Right: % change at four weeks from baseline. Left plot: Six failures and one retreated were caught by baseline criteria (five failures and one retreated have cavity air >=30 and two have TLG>1500); Right plot: Two retreated subjects were selected by week 4 cavity air criteria (decrease of cavity air < 20%). Two additional retreated cases and one failure were caught by Week 16 Xpert <30.
Finally, we included a measure of residual TB bacterial load in sputum in the early treatment completion criteria based on an analysis that Xpert cycle threshold around 30 at weeks 8 and 24 correlated with culture negativity and patient treatment outcomes29. We incorporated this measure at week 16 as a safety mechanism to ensure that participants with higher sputum bacterial load (cycle threshold <30) did not stop treatment early. Combining the baseline and week 4 criteria stratified 41/81 (50.6%) of all cured and failure patients as low risk (Table 4). When applied to the entire Catalysis cohort, including retreatment patients, 1/8 (12.5%) failures and 6/11 (54.5%) retreatments were captured as low risk. The PredictTB early treatment completion criteria when the trial started is shown in Table 5a.
| Early completion criteria: | Determined at Week 16 – unless known to have failed a radiologic criterion at baseline or week 4. |
|---|---|
| Radiologic criteria | Baseline PET/CT: • No total lung collapse of a single side, AND • No pleural effusion, AND • No single cavity air volume on CT scan >30 mL, AND • CT scan hard volume (-100 to +100 HU density) <200 mL, AND • PET total lesion glycolysis <1500 units Week 4 PET/CT: • All individual cavities decrease by >20% (unless cavity <2 mL), AND • CT scan hard volume does not increase by >10% unless the increase is <5 mL, AND • PET total lesion glycolysis does not increase by >30% unless the increase is <50 units |
| Bacterial load criterion | Week 16 Xpert cycle threshold ≥30* |
| Adherence criterion | Minimum of 100 doses received by week 16 |
*If the week 16 solid medium sputum culture is subsequently found to be positive for Mtb in a participant randomized to Arm B or C, this participant will be called in for evaluation and to provide sputum for a repeat culture. If the initial positive culture is confirmed by a second culture positive for Mtb, this participant will be considered to have met the study endpoint as a treatment failure and will be referred for continued treatment.
TB, tuberculosis; PET, positron emission tomography; CT, computed tomography; HU, Hounsfield unit.
The initial criteria were established as described above, acknowledging that early changes may be needed once the trial began if the actual proportion of PredictTB study participants stratified to the low- and high-risk arms were not close to the 50:50 target. Indeed, after about nine months of enrollment, only 23.4% of participants to reach week 16 were stratified as low risk (Arms B and C), with the remainder stratified to the high-risk arm (Arm A). This was less than half of the estimated 50% we expected to be low risk, which had major implications for the cost and duration of the study (total sample size, study duration, and cost would need to be increased to achieve required sample size in Arms B and C) as well as the scientific relevance of the study (if trial successful, it would only apply to less than 25% of TB patients, diminishing relevance). After discussion with our study Data and Safety Monitoring Board (DSMB), we revised our study early treatment completion criteria.
We considered how to change both the Xpert cycle threshold cutoff and the PET/CT radiology thresholds. For the Xpert cycle threshold, the original cutoff at week 16 was based on a cohort study in South Africa with MGIT culture results, the only data available to us at the time. We adopted a stringent cycle threshold value of 30 based upon analysis of these data for subjects to be randomized to Arms B and C. Xpert detects bacterial DNA but does not determine the viability of detected DNA (i.e., detected bacteria may be dead). For PredictTB, however, LJ culture is used to determine primary study outcomes. For this re-analysis, we received unpublished results from TBTC study 29, which collected cycle threshold values and LJ culture results (Rada Savic, personal communication). In evaluating the change, we considered the chance of missing an LJ+ result, as well as the sensitivity and specificity of various cycle threshold cutoffs. In contrast to positive and negative predictive values, sensitivity and specificity do not depend on the underlying proportion of culture positive results, which varies over time and from study to study. That said, patient safety was a driving factor so we considered how many positive cultures might be missed for various cutoffs. This was defined as the probability of being LJ+ given a Xpert cycle threshold value less than the cutoff, i.e., P(LJ+ | Ct-). We assumed what we considered were high proportions of LJ+ cultures (i.e., 10% and 5% at week 16 of treatment in the lower risk cohort of arm B/C) when making this decision. In contrast to TBTC study 29, which randomized all-comers and did not stratify participants by risk, the PredictTB study further excludes poorly adherent participants, those with too severe disease at baseline, or those not responding appropriately to treatment at one month. As a result, the expected LJ+ rates of 10% and 5% were considered to be very high. Table 6 describes these proportions for the sensitivity and specificity estimates from TBTC study 29. Based on these estimates, a cycle threshold of 30 was expected to miss 2.1% of LJ+ results, while a threshold of 28 would miss 2.5%, assuming a 10% LJ+ rate. This translated to an increase in less than one participant being missed among those randomized to arm C. That is, if the background LJ+ rate was 10%, 3.3 (of 155 randomized to stop treatment at week 16) true LJ+ participants may be missed with a cycle threshold of 30, and 3.9 may be missed with a cycle threshold of 28. If the underlying LJ+ rate was 5%, this becomes 1.6 missed LJ+ participants with cycle threshold 30 and 1.9 missed LJ+ participants with cycle threshold 28. If the true underlying LJ+ rate was even lower (as we would expect it to be), the difference between the two cycle threshold values becomes even smaller. Of the 12 participants already enrolled in the PredictTB study with week 16 Xpert cycle threshold results at the time of this analysis, eight had negative results, two had cycle thresholds below 28 (18.2 and 25.2) and two had cycle thresholds above 28 (28.4 and 28.5). Thus changing the Xpert cycle threshold cutoff from 30 to 28 would potentially (depending on radiology criteria) have retained an additional two participants in arms B and C.
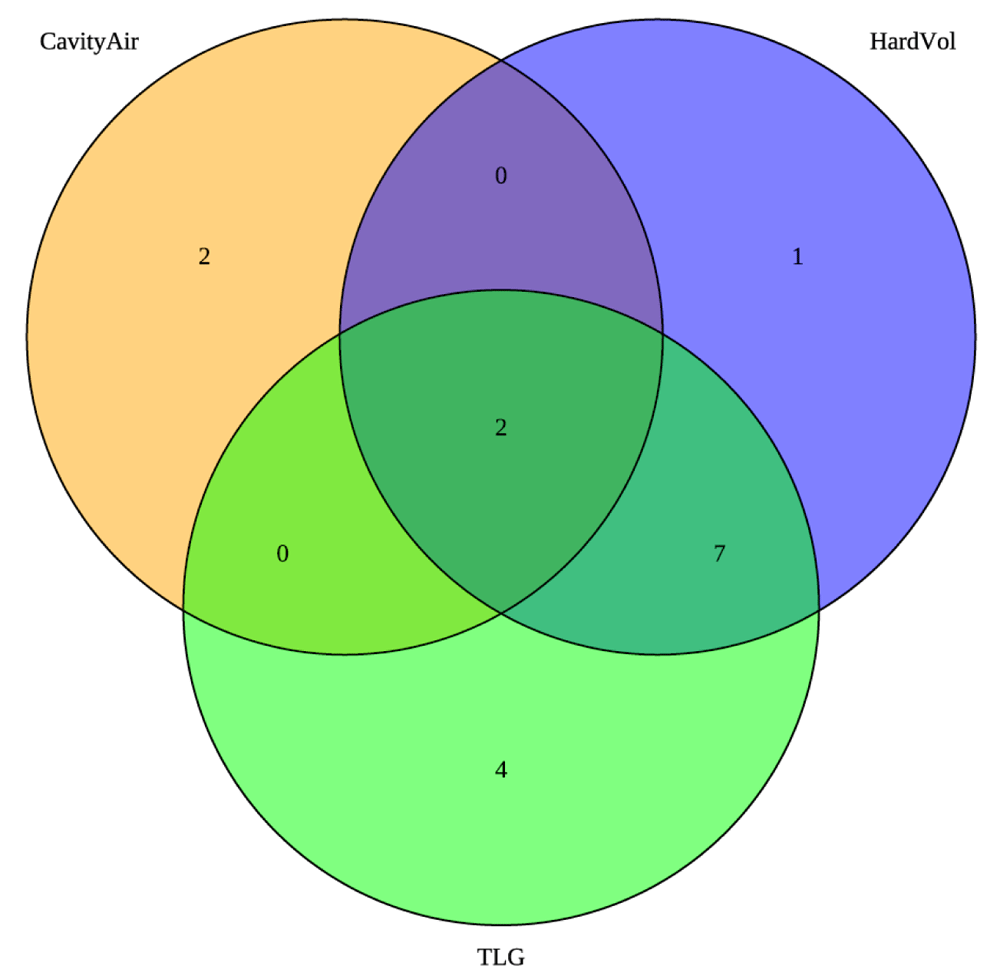
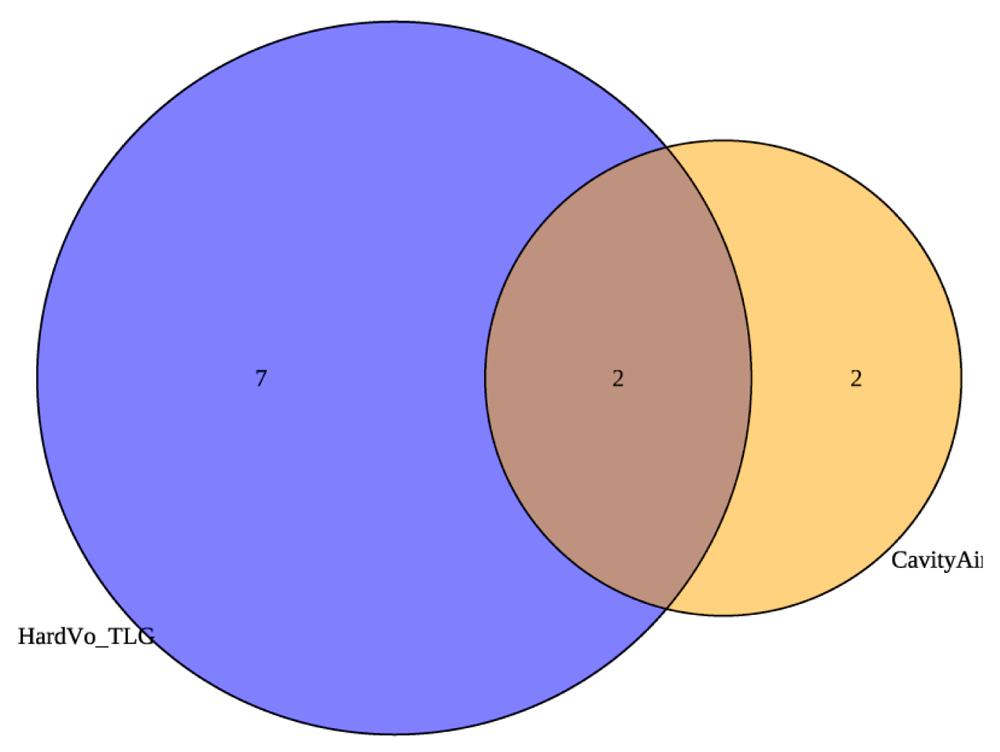
To further correct the arm imbalance, we also changed the baseline and week 4 radiologic criteria. Prior studies validated that cavity on baseline CXR is a risk factor for treatment relapse. In our analyses of prior data, cavity size was also the strongest factor in predicting poor treatment outcome so we did not adjust this criterion. The data for CT hard volume and PET TLG as risk factors for poor treatment outcomes, however, were weak. Figure 3a shows the distribution of participants stratified to Arm A at baseline by the original radiology criteria. The numbers in the circles represent the number of participants that fell into arm A according to the defined criteria. The hard volume and total activity criteria were relatively well correlated in capturing participants, with only five participants moved to Arm A based on a single criterion, hard volume or PET TLG. Therefore, instead of arbitrarily increasing the hard volume and PET TLG cutoffs, we changed the criteria from requiring both hard volume AND total activity to be below the thresholds to be considered low risk, to only requiring one criterion. That is, participants with either hard volume OR total activity below the threshold at both baseline and week 4 would be considered low risk. The thresholds themselves did not change. Applying this change to the PET/CT criteria results in the revised Venn diagram in Figure 3b, which is the same as Figure 3a except for the five participants moved to Arm A based on hard volume or PET activity alone are no longer considered high risk. The revised early treatment completion criteria incorporating both Xpert cycle threshold and radiologic criteria changes are shown in Table 5b.
Changes are highlighted in yellow.
| Early completion criteria: | Determined at Week 16 – unless known to have failed a radiologic criterion at baseline or week 4. |
|---|---|
| Radiologic criteria | Baseline PET/CT: • No total lung collapse of a single side, AND • No pleural effusion, AND • No single cavity air volume on CT scan >30 mL, AND • CT scan hard volume (-100 to +100 HU density) <200 mL OR PET total lesion glycolysis <1500 units Week 4 PET/CT: • All individual cavities decrease by >20% (unless cavity <2 mL), AND • CT scan hard volume does not increase by >10% unless the increase is <5 mL OR PET total lesion glycolysis does not increase by >30% unless the increase is <50 units |
| Bacterial load criterion | Week 16 Xpert cycle threshold ≥28* |
| Adherence criterion | Minimum of 100 doses received by week 16 |
*If the week 16 solid medium sputum culture is subsequently found to be positive for Mtb in a participant randomized to Arm B or C, this participant will be called in for evaluation and to provide sputum for a repeat culture. If the initial positive culture is confirmed by a second culture positive for Mtb, this participant will be considered to have met the study endpoint as a treatment failure and will be referred for continued treatment.
TB, tuberculosis; PET, positron emission tomography; CT, computed tomography; HU, Hounsfield unit.
The revised early treatment completion criteria were accepted by the NIAID DSMB on March 16, 2018 and implemented after local regulatory approvals at the Henan, China sites on May 19, 2018 and at the Western Cape, South Africa sites on June 15, 2018. Only 12 (3.9%) of the total sample size of 310 to the low risk arms were recruited under the original early treatment completion criteria. The revised criteria re-balanced the arm proportions very nicely, approaching 50:50 in Arms A and B/C. The data used to develop both the original and revised early treatment completion criteria are deposited on Harvard Dataverse (see Data availability).
Previously conducted treatment shortening studies for DS-TB suggested that approximately 80-85% of patients are cured with four months of treatment1–4. Shortening treatment only in lower risk participants who had no cavity on baseline chest x-ray and had sputum culture converted to negative by two months of treatment resulted in the four-month treatment success proportion increasing to 93% in one trial but this was still significantly worse than six months of treatment8. The PredictTB trial tests an alternate risk stratification criteria based on FDG-PET/CT disease burden at baseline, the change in PET/CT disease burden at week 4 of treatment, and a marker of residual bacterial load and adherence dose count at the end of treatment, hypothesizing that this combination will identify patients with tuberculosis who are cured with four months of standard treatment5. Risk signatures based on transcriptomics have recently been shown to correlate with treatment outcomes33,34.
The development of the PredictTB early treatment completion criteria was based on a cohort of 92 DS-TB patients programmatically treated in Cape Town, South Africa on whom we had PET/CT scans at baseline and week 4 of treatment, Xpert cycle threshold data, and programmatic treatment outcomes (Catalysis cohort). Because these patients were treated programmatically, treatment was not directly observed and we were thus unable to determine the proportion of treatment failures due to poor adherence or differentiate true relapsed disease patients from those re-infected. The lack of these data confounded our attempts to develop early treatment completion criteria that captured treatment failure and true relapse patients with meaningful sensitivity and specificity. We resorted to developing criteria that stratified about 50% of patients as high risk, trusting that the most severely diseased patients at baseline, those with poor treatment responses at week 4, and those under the Xpert cycle threshold cutoff at week 16 were captured as higher risk and therefore not eligible for treatment shortening.
A major limitation of developing our algorithm was the lack of sufficient relapse data to validate our early treatment completion criteria. This limitation is challenging to overcome, given the small numbers of available patient data anywhere with microbiological, strain-type confirmed relapses and the even smaller numbers of these with FDG-PET/CT scan data. We acknowledge the risk of overfitting our data (i.e., producing a risk model that may not be generalizable because it was fit only to the data on which it was developed) and in fact, after the study started, it became clear that our criteria were too conservative, stratifying >75% of participants as high risk and therefore not eligible for treatment shortening. Without immediate correction, we would likely run out of funding before the end of the trial due to the increased total sample size needed to achieve the required lower risk cohort sample size. Even worse, we would end up with a trial result that was applicable only to the 20–25% of patients stratified to the lower risk arms and therefore not relevant to the majority TB patients. Our amended early treatment completion criteria, however, have been stratifying participants at roughly 50:50 to the high- vs. low-risk arms.
The PredictTB trial early treatment completion criteria were developed to identify those with the most severe disease at baseline (potentially at higher risk for treatment failure) and with a poor week 4 treatment response (potentially at higher risk of relapse), along with a marker of residual bacterial load and an adherence dose count at treatment completion. These criteria are currently stratifying about 50% of patients to the higher risk arm and 50% of patients to the two lower risk arms, which is the target goal. Whether or not this will successfully identify a lower risk cohort that can be successfully cured with four months of standard therapy awaits the results of the trial, expected in 2022.
Harvard Dataverse: Replication Data for PredictTB Early Treatment Completion Criteria. https://doi.org/10.7910/DVN/97HYQ535.
Data are available under the terms of the Creative Commons Zero "No rights reserved" data waiver (CC0 1.0 Public domain dedication).
| Views | Downloads | |
|---|---|---|
| Gates Open Research | - | - |
|
PubMed Central
Data from PMC are received and updated monthly.
|
- | - |
Provide sufficient details of any financial or non-financial competing interests to enable users to assess whether your comments might lead a reasonable person to question your impartiality. Consider the following examples, but note that this is not an exhaustive list:
Sign up for content alerts and receive a weekly or monthly email with all newly published articles
Register with Gates Open Research
Already registered? Sign in
If you are a previous or current Gates grant holder, sign up for information about developments, publishing and publications from Gates Open Research.
We'll keep you updated on any major new updates to Gates Open Research
The email address should be the one you originally registered with F1000.
You registered with F1000 via Google, so we cannot reset your password.
To sign in, please click here.
If you still need help with your Google account password, please click here.
You registered with F1000 via Facebook, so we cannot reset your password.
To sign in, please click here.
If you still need help with your Facebook account password, please click here.
If your email address is registered with us, we will email you instructions to reset your password.
If you think you should have received this email but it has not arrived, please check your spam filters and/or contact for further assistance.
Comments on this article Comments (0)